1. Home > 
  2. Stock Photos > 
  3. Financial Decline Concept with Dynamic Data Over Sponges

Financial Decline Concept with Dynamic Data Over Sponges Image

Financial Decline Concept with Dynamic Data Over Sponges

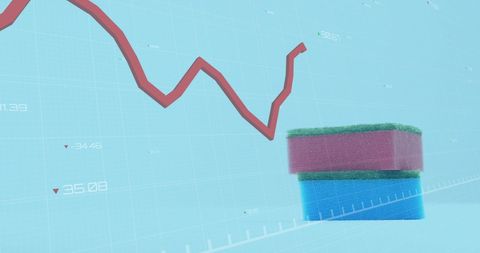
Red graph line indicates economic downturn alongside common kitchen sponges that symbolize domestic responsibilities amid financial concepts. Useful for illustrating global financial crises, market-induced financial stress, and combining everyday life with broader economic trends.

Powered by Shutterstock logo - Get 15% off with code: PIKWIZARD15
Digital graph displays a downward trend, indicating a market decline. The image captures the concept of financial loss or economic downturn. - Powered by Shutterstock - Get 15% off with code: PIKWIZARD15Dramatic stock market crash, red downward arrows and declining financial charts superimposed  business Trading, economic downturns and market volatility, money, investment advisories, market risks - Powered by Shutterstock - Get 15% off with code: PIKWIZARD15Businessman pointing at downward trend candlestick chart on virtual interface for stock market crash, economic decline, or financial loss warning - Powered by Shutterstock - Get 15% off with code: PIKWIZARD15Percentage sign on wooden cubes with Stack of coin bar chart and red graph trending downwards on white background. Economy recession crisis, inflation, stagflation, business and financial loss concept - Powered by Shutterstock - Get 15% off with code: PIKWIZARD15This image depicts a financial chart with a clear downward trend, suggesting market volatility - Powered by Shutterstock - Get 15% off with code: PIKWIZARD15

Credit Photo

If you would like to credit the Photo, here are some ways you can do so

Free (free of charge)

Free for personal and commercial use.

Author: Awesome Content

Similar Free Stock Images

Financial Data Visualization on Graph with Glowing Indicator
Premium
Percentage sign on wooden cubes with Stack of coin bar chart and red graph trending downwards on nature background. Economy recession crisis, inflation, stagflation,business and financial loss concept
Financial Data on USA Flag Background Symbolizing Economics
Futuristic Financial Graphs with Dynamic Green Line
Digital Rouble Symbol with Financial Data Visualizations
Descending Trend Graph on Pink Gradient Background
Premium
This image depicts a financial chart with a clear downward trend, suggesting a market downturn or economic recession
Dynamic Financial Graph Analyzing Market Trends
Ukraine Economic Crisis with Financial Graph Overlay
Digital Graph Overlay on Gabon Flag Representing Financial Data Trends
Financial Market Growth Over City Skyline
Premium
Creative downward forex chart on blurry night city background. Crisis and collapse concept. Double exposure
Declining Graph Overlay on Night Traffic Scene Illustrates Downtrend
Digital Data Processing with Neon Frame Highlighting Trends
Financial Market Chart on Digital Screen Showing Growing Trends
Diverse Businesswomen Analyzing Financial Growth Chart in Office
Premium
This image depicts a financial graph with an upward and downward trend, representing market fluctuations
Digital Security and Economic Networking Data Concept
Downward Stock Market Trends with Financial Data Graphs
Dynamic Red Line Graph on Digital Black Grid Background
Colorful Graph Analysis in Digital Interface Over Blue Background
Premium
Close-up of a financial graph with a downward trend, indicating a potential market downturn or loss. The graph is displayed on a screen.
Green Financial Data Chart with Technological Overlay
Dynamics of Financial Growth in Modern Business Setting
Financial Chart Overlay on Modern Office Background
Colleagues Analyzing Financial Data Visualization in Modern Office
Premium
This image depicts a financial chart with a clear downward trend, indicating potential losses or a market downturn
Financial Market Decline with Red Line Graph Overlay
Analyzing Growing Graph Line on Purple Gradient Background
Financial Data Visualization with Declining Trend Line
Futuristic Data Analysis with Digital Graphs on Gradient
Rising Green Line on Financial Digital Display
Financial Data Analysis with Vibrant Lines on Blue Background
Premium
A close-up shot of a stock market graph on a screen, with a pen indicating a downward trend, symbolizing financial loss and market decline.
Creative Financial Data Concept with Kitchen Sponges
Data Processing Overlay on Map of Europe Financial Concept
Data Analytics Graph and Technology Interface
Business Data Analysis with Red Declining Graph on Office Desk Background
Premium
This image depicts a financial chart with a clear downward trend, suggesting potential market decline
Financial Data Growth Over Urban Cityscape with Graph Overlay
Green Line Graph Overlaying Modern Office Setting
Red Financial Trendline in Digital Interface Background
Businesswoman Discussing Market Trends with Digital Chart Overlay
Premium
A picture of a downward trend and a bleak outlook for the DOWN block.
Digital Lock with Real-Time Data Display
Global Financial Data Trends on World Map
Downward Trending Graph with Office Background
Dynamic Data Chart on Dark Digital Background
Premium
Economic caution visualized with fluctuating market graph, alert symbols, and negative data trends. Represents financial risk, market volatility, and economic uncertainty. Muxer
Falling Line Graph Illustrates Decreasing Financial Trends
Financial Data Graph with Rising Green Line and Analytics Dashboard
Dynamic Financial Data Visual Display with Graph Annotations
Analyzing Statistical Data Over Digital Network With Cityscape
Premium
A close-up of a stock market graph on a computer screen, with a red line indicating a downward trend, suggesting financial loss.
Financial Chart with Falling Trends in Corporate Environment
Dynamic Stock Market Graph Fluctuating in Modern Office
Diverse Business Team Analyzing Financial Data Illustration
Financial Data Analytics Over Changing Line Graphs
Premium
This image shows a stock market chart with a sell signal, indicating a potential downward trend in the market
Stock Market Decline Data Analysis on Dark Grid Background
Armenian Flag with Financial Graph Overlay Depicting Market Trends
Dynamic Financial Market Graph with Data Points
Red Declining Graph on Digital Grid Display Represents Falling Markets
Dynamic Financial Market Trends with Data Visualizations
Economic Trends Depicting Ukraine Crisis Concept
Premium
The image shows a stock market chart with red lines indicating a downward trend, representing financial losses
Dynamic Data Trends Over Digital Graph with Pink Background
Digital Financial Data Interface on Green Background
Data Decline Concept with Graph Over Ocean
Economic Crisis Graph Over Ukraine Flag Illustrating Financial Downturn
Premium
The chart illustrates a decline in financial data, possibly indicating a market downturn or economic instability
Dynamic Line Graph on Business Office Background Depicting Growth
Dynamic Data Charts on Geometric Abstract Background
Declining Financial Market Chart Over Grid Background
Cityscape Blended with Graphs Showing Finance Trends
Premium
A picture of a downward trend and a bleak outlook for the DOWN block.
Financial Analytics Chart in Digital Interface Design
Dynamic Financial Growth Graph on Blue Grid Background
Dynamic Financial Data Representation on Digital Grid
Financial Data Graph Overlay on Modern Office Background
Premium
The stroller is depicted on a downward trending graph showing declining birth rates against a blue colored grid.
Financial Data Visualization with Red Downtrend Line in Virtual Environment
Computerized Analysis Over Futuristic Cityscape Background
Dynamic Stock Market Data and Cityscape Background
Financial Data Graphics Overlaying Abstract Flames Background
Premium
Financial chart with red downward trend line, symbolizing economic crisis, recession, market volatility, and risk management.
Global Financial Graph Showing Decline Indicating Recession
Two Businesswomen Analyzing Growing Financial Trends in Office
Digital Financial Data Processing with Trend Lines
Financial Data Analysis with Declining Trend on Blueprint Graph
Premium
A blue zigzag arrow with a downward trend reflects on a black surface, symbolizing financial decline. High quality photo.
Green Line Graph Overlaid on Empty Office with Data Overlay
Dynamic Financial Data Analysis Concept with Graph Lines and Orange Background
Dynamic Financial Graph with Statistical Analysis Lines
Global Data Processing Over Interactive World Map
Ukraine Crisis Economic Downturn Illustrated by Financial Graph
Economic Downtrend Illustrating Recession Concepts with Sponges
Premium
This chart illustrates financial data, perfect for presentations on investments and market fluctuations
Green Financial Data Line Graph Over Cityscape Background
Financial Data Graph Over Urban Cityscape
Financial Graph Over Ukraine Flag Illustrates Economic Trends
Dynamic Financial Data Charts on Dark Digital Background
Premium
Close-up of a stock market graph with red lines indicating a downward trend, suggesting financial losses or market decline.
Financial Data Integration with Agricultural and Environmental Landscapes
Dynamic Graph Analysis over Covid-19 Virus Cells
Global Data Analysis with Digital Interface
Financial Data Visualization with Green Graph Line on Blue Background
Premium
A picture of a downward trend and a bleak outlook for the DOWN block.
Rising Data Graph with Changing Numbers on Blue Grid
Declining Financial Graph Over Data Grid with Global Background
Financial Data Overlay on Office Computers
Declining Stock Market Graph with Red Trend Line
Premium
Close-up of multiple stock market charts with red lines indicating a downward trend, suggesting financial losses or market instability.
Global Financial Data Visualization with Digital Overlays
Dynamic Financial Statistics with Cityscape Overlay
Global Financial Data Trading Analytics Over Flames Concept
Fluctuating Stock Chart Overlay in Modern Office Environment
Premium
This image shows a close-up of a financial data chart with various colored lines, representing market trends and analysis
Abstract Financial Graph Displayed on Office Monitor
Digital Interface with Overlapping Code and Graph
Fluctuating Financial Graph on Digital Orange Background
Digital Decline Graphic with QR Code Elements and Red Line
Premium
A blurry image of a man in front of a red stock market graph showing a downward trend, symbolizing financial crisis or market drop
Red Line Graph Overlaying Office Computers Symbolizing Data Analysis