- Home >
- Stock Photos >
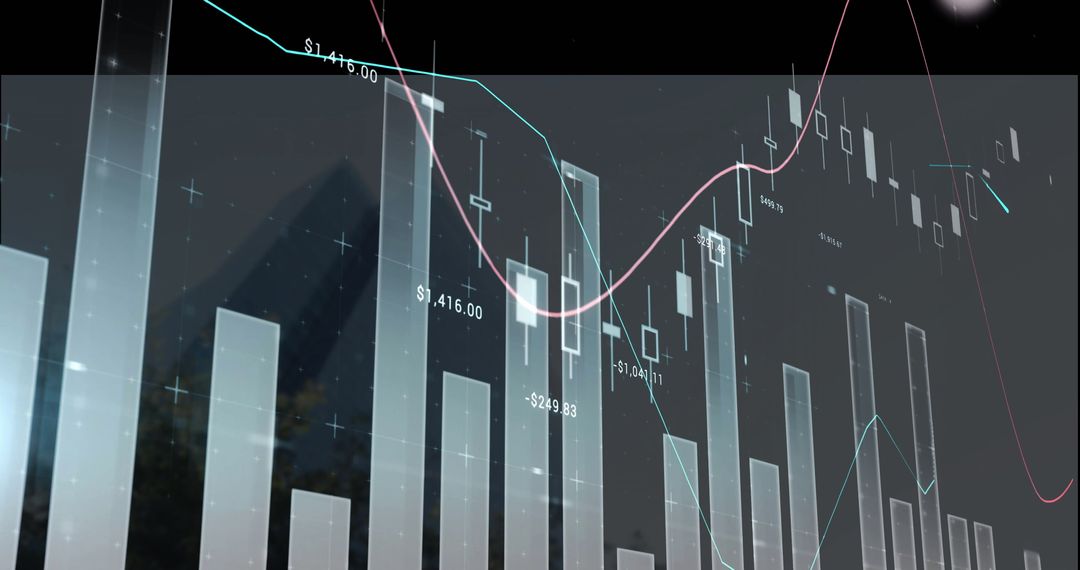
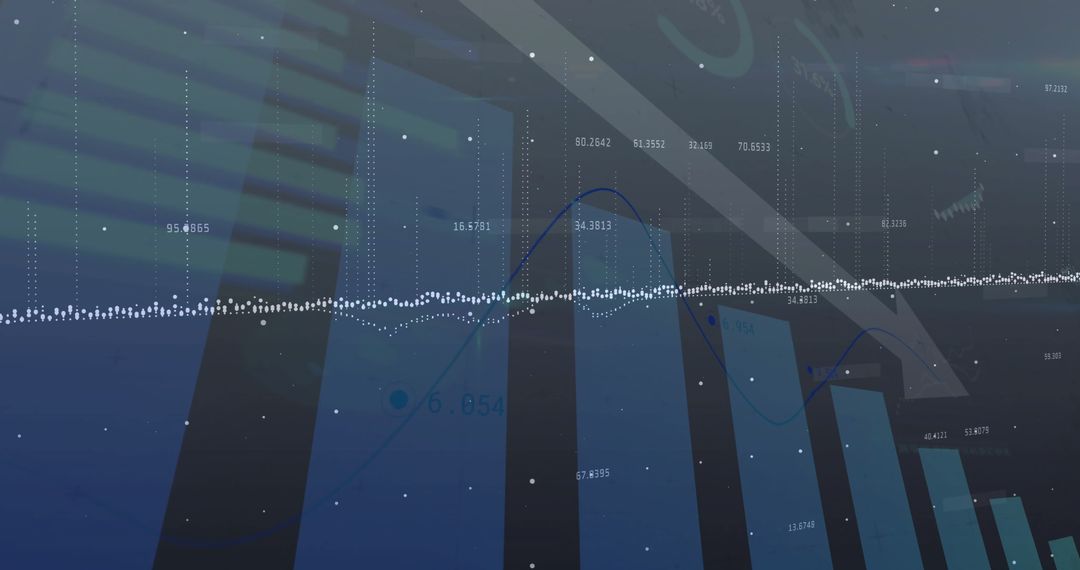
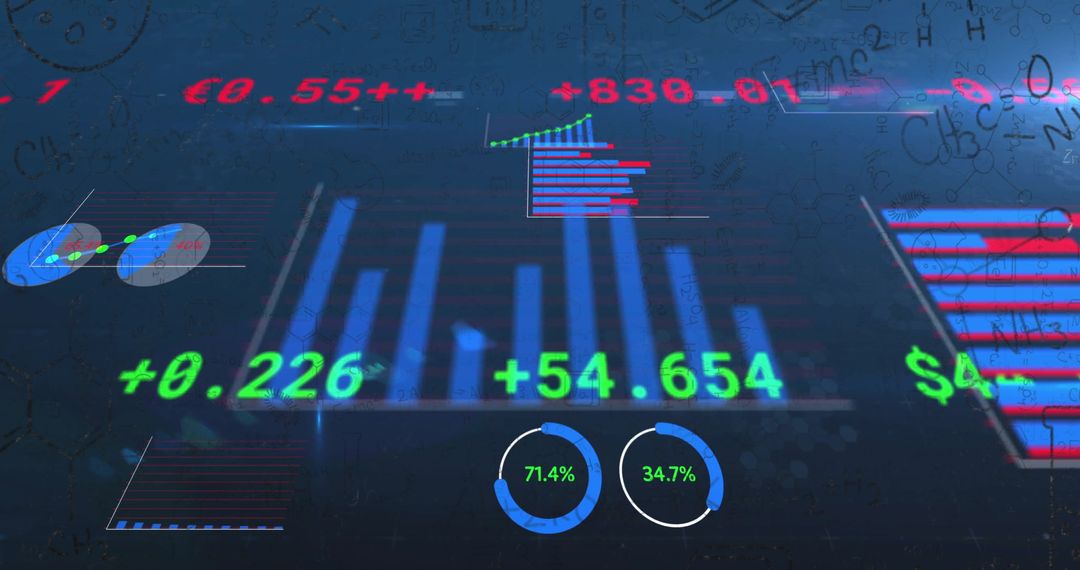
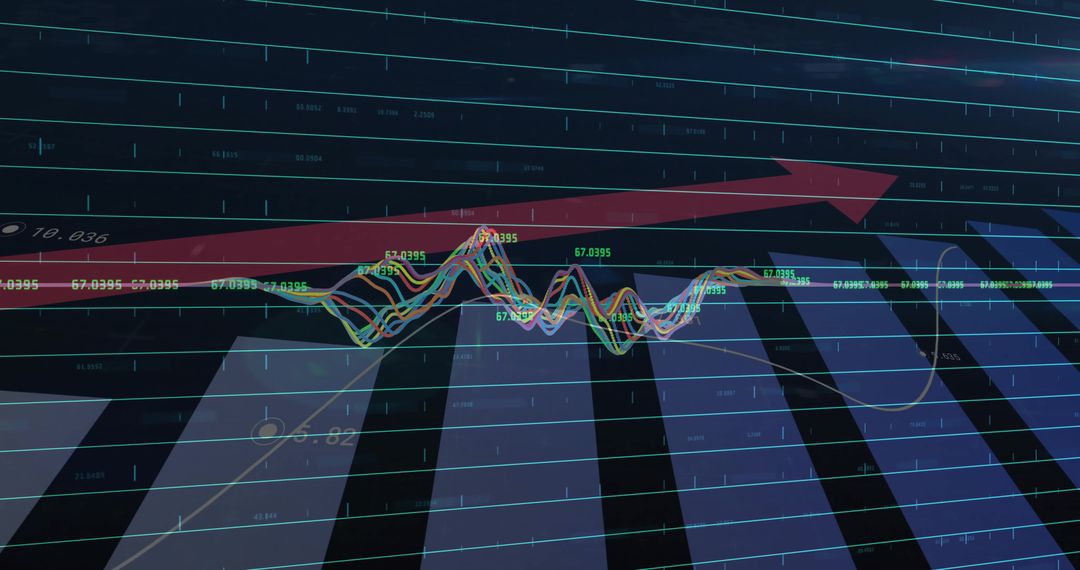
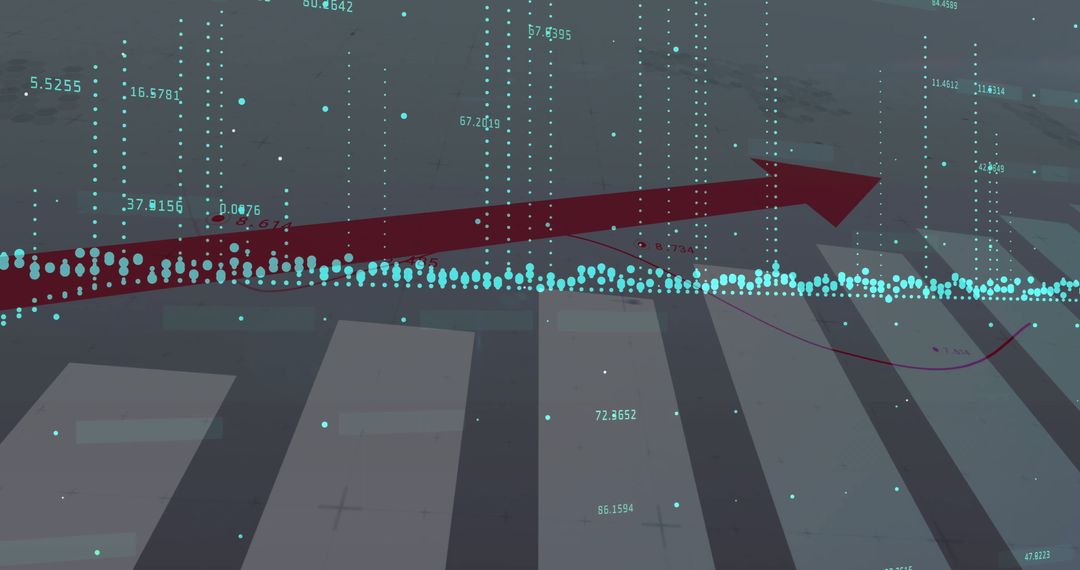
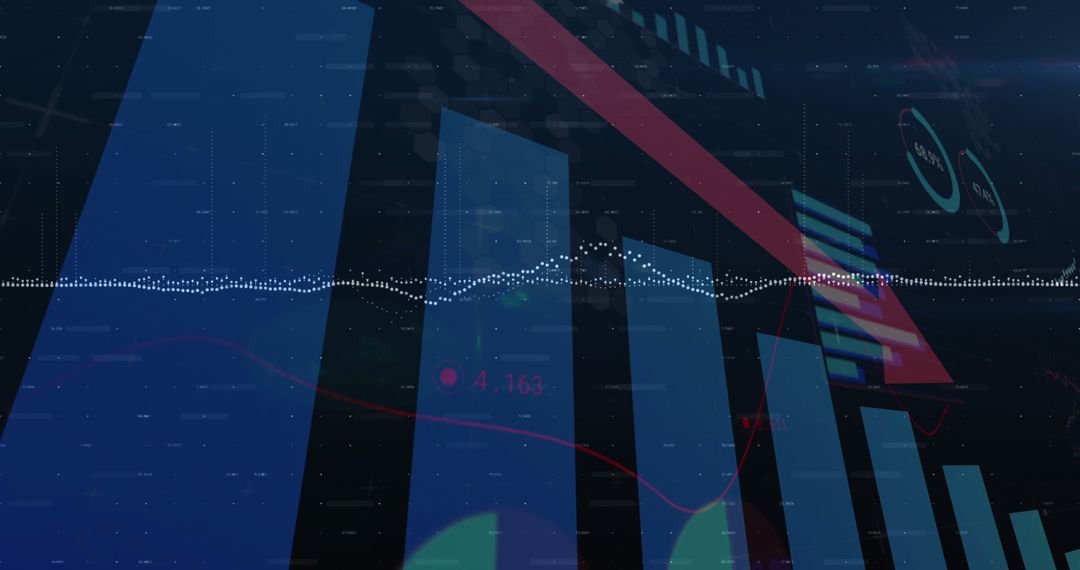
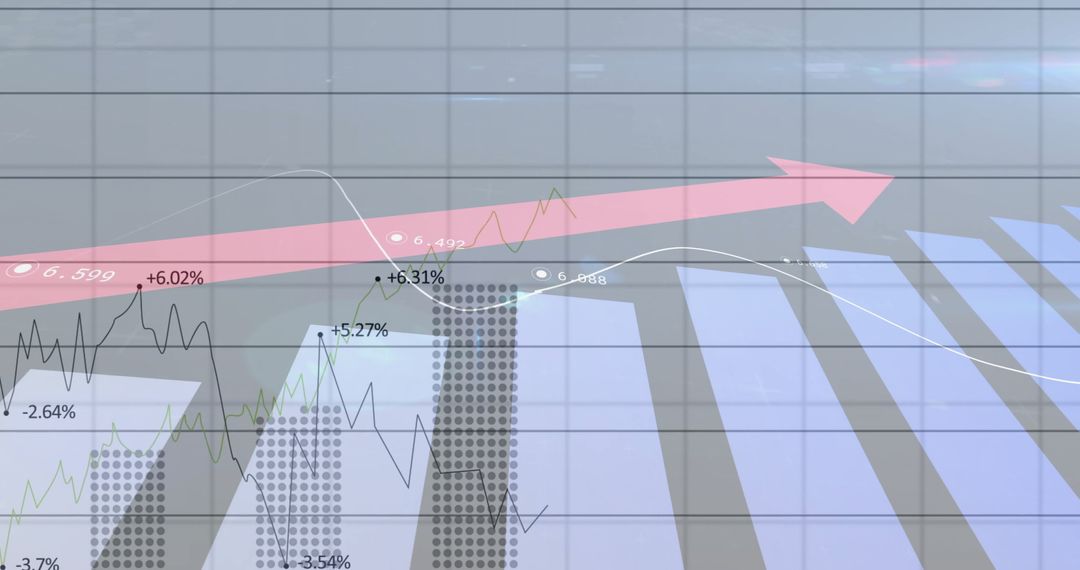
- Financial Downward Trend Bar Chart on Dashboard with Red Arrow
Financial Downward Trend Bar Chart on Dashboard with Red Arrow Image

Depicts a financial dashboard illustrating a negative data trend with a bar chart and a prominent red arrow going downwards. The blue bars represent monthly data, interspersed with detailed charts indicating changing metrics and outcomes over time. Appropriate for financial reports, presentations focusing on economic challenges, market analysis, and educational content showing the concept of market decrease.
Powered by  - Get 15% off with code: PIKWIZARD15


0
downloads
downloads
Tags:
More
Credit Photo
If you would like to credit the Photo, here are some ways you can do so
Text Link
photo Link
<span class="text-link">
<span>
<a target="_blank" href=https://pikwizard.com/photo/financial-downward-trend-bar-chart-on-dashboard-with-red-arrow/358e3ed37d487c78f6b9d341d5546aef/>PikWizard</a>
</span>
</span>
<span class="image-link">
<span
style="margin: 0 0 20px 0; display: inline-block; vertical-align: middle; width: 100%;"
>
<a
target="_blank"
href="https://pikwizard.com/photo/financial-downward-trend-bar-chart-on-dashboard-with-red-arrow/358e3ed37d487c78f6b9d341d5546aef/"
style="text-decoration: none; font-size: 10px; margin: 0;"
>
<img src="https://pikwizard.com/pw/medium/358e3ed37d487c78f6b9d341d5546aef.jpg" style="margin: 0; width: 100%;" alt="" />
<p style="font-size: 12px; margin: 0;">PikWizard</p>
</a>
</span>
</span>
Free (free of charge)
Free for personal and commercial use.
Author: Creative Art
Similar Free Stock Images

Premium


Premium


Premium


Premium


Premium


Premium


Premium


Premium


Premium


Premium


Premium


Premium


Premium


Premium


Premium


Premium


Premium


Premium


Premium


Premium


Premium


Premium


Premium


Premium