
- Home >
- Stock Photos >
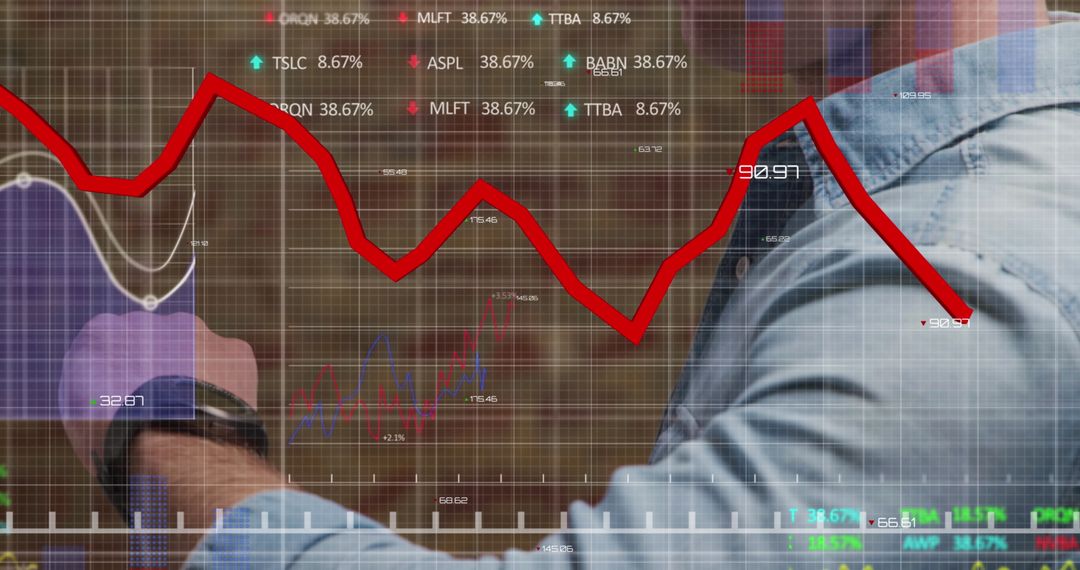
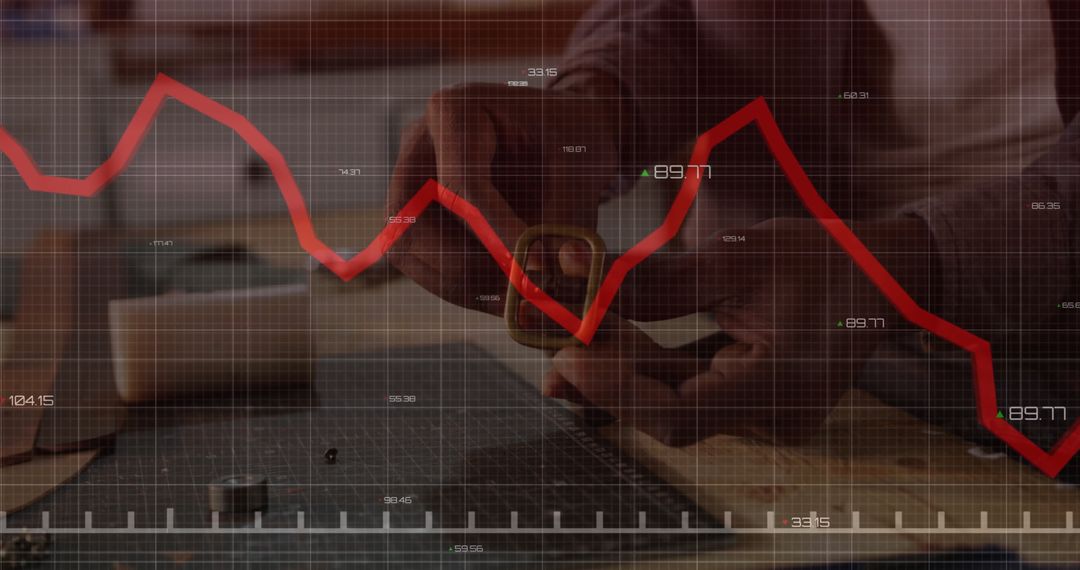
- Financial Expert Analyzing Data with Graph Overlay
Financial Expert Analyzing Data with Graph Overlay Image

Image shows a businessman focused on analyzing financial data with red graph lines and calculations against a modern office backdrop. Useful for topics on global business, finance professionals, data processing in business environment and economic trends visuals.
Powered by  - Get 15% off with code: PIKWIZARD15


0
downloads
downloads
Tags:
More
Credit Photo
If you would like to credit the Photo, here are some ways you can do so
Text Link
photo Link
<span class="text-link">
<span>
<a target="_blank" href=https://pikwizard.com/photo/financial-expert-analyzing-data-with-graph-overlay/4c9d32cdbd655cbac505046d79dd7080/>PikWizard</a>
</span>
</span>
<span class="image-link">
<span
style="margin: 0 0 20px 0; display: inline-block; vertical-align: middle; width: 100%;"
>
<a
target="_blank"
href="https://pikwizard.com/photo/financial-expert-analyzing-data-with-graph-overlay/4c9d32cdbd655cbac505046d79dd7080/"
style="text-decoration: none; font-size: 10px; margin: 0;"
>
<img src="https://pikwizard.com/pw/medium/4c9d32cdbd655cbac505046d79dd7080.jpg" style="margin: 0; width: 100%;" alt="" />
<p style="font-size: 12px; margin: 0;">PikWizard</p>
</a>
</span>
</span>
Free (free of charge)
Free for personal and commercial use.
Author: Authentic Images
Similar Free Stock Images

Premium


Premium


Premium


Premium


Premium


Premium


Premium


Premium


Premium


Premium


Premium


Premium


Premium


Premium


Premium


Premium


Premium


Premium


Premium


Premium


Premium


Premium


Premium


Premium

