- Home >
- Stock Photos >
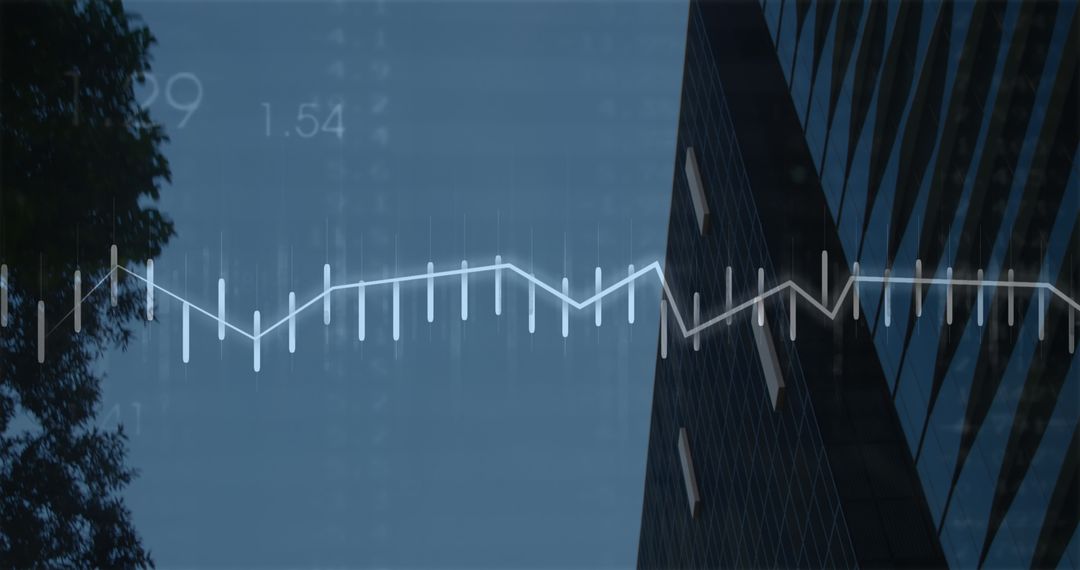
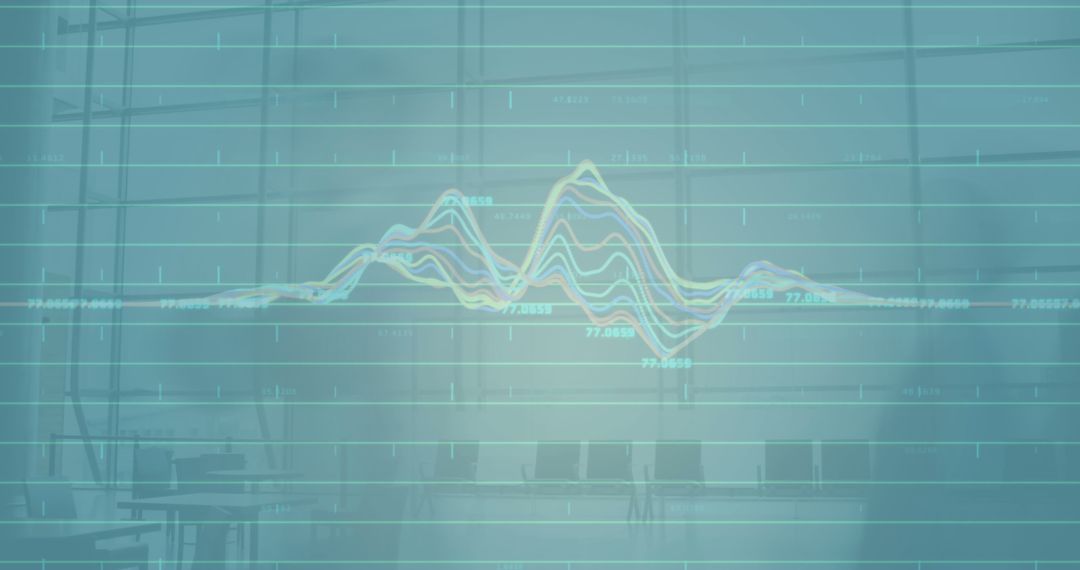
- Financial Graph Overlay on Industrial Setting Abstract Concept
Financial Graph Overlay on Industrial Setting Abstract Concept Image

In the image, vibrant financial graphs illustrate data trends and growth patterns, which overlay an industrial-inspired ambient scene, reinforcing ideas of progress and technology. Useful for representing financial growth, stock market predictions, or integrating technology in business and industrial processes. Ideal for presentations, financial reports, or technological advancements advertisements.
Powered by  - Get 15% off with code: PIKWIZARD15


2
downloads
downloads
Tags:
More
Credit Photo
If you would like to credit the Photo, here are some ways you can do so
Text Link
photo Link
<span class="text-link">
<span>
<a target="_blank" href=https://pikwizard.com/photo/financial-graph-overlay-on-industrial-setting-abstract-concept/7a1daffa9dba939278b4ee8cc809f58a/>PikWizard</a>
</span>
</span>
<span class="image-link">
<span
style="margin: 0 0 20px 0; display: inline-block; vertical-align: middle; width: 100%;"
>
<a
target="_blank"
href="https://pikwizard.com/photo/financial-graph-overlay-on-industrial-setting-abstract-concept/7a1daffa9dba939278b4ee8cc809f58a/"
style="text-decoration: none; font-size: 10px; margin: 0;"
>
<img src="https://pikwizard.com/pw/medium/7a1daffa9dba939278b4ee8cc809f58a.jpg" style="margin: 0; width: 100%;" alt="" />
<p style="font-size: 12px; margin: 0;">PikWizard</p>
</a>
</span>
</span>
Free (free of charge)
Free for personal and commercial use.
Author: People Creations
Similar Free Stock Images

Premium


Premium


Premium


Premium


Premium


Premium


Premium


Premium


Premium


Premium


Premium


Premium


Premium


Premium


Premium


Premium


Premium


Premium


Premium


Premium


Premium


Premium


Premium


Premium