
- Home >
- Stock Photos >
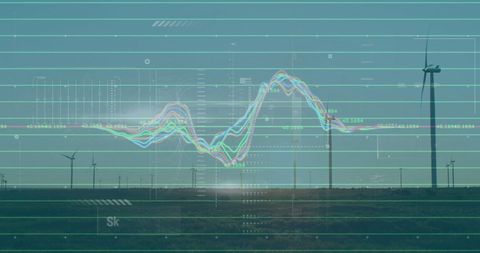
- Financial Graph Overlaying Retail Store Backdrop Visualizing Market Trends
Financial Graph Overlaying Retail Store Backdrop Visualizing Market Trends Image

Dynamic overlay of financial graphs showcases market trends within a retail environment backdrop. Suitable for illustrating modern business analytics, data analysis, technology in shopping contexts, or online financial transactions. Ideal for presentations, technology commercials, or reports discussing the intersection of retail and financial markets.
Powered by  - Get 15% off with code: PIKWIZARD15


2
downloads
downloads
Tags:
More
Credit Photo
If you would like to credit the Photo, here are some ways you can do so
Text Link
photo Link
<span class="text-link">
<span>
<a target="_blank" href=https://pikwizard.com/photo/financial-graph-overlaying-retail-store-backdrop-visualizing-market-trends/4bb1a66f6a0278fe714dd524bb87a5f4/>PikWizard</a>
</span>
</span>
<span class="image-link">
<span
style="margin: 0 0 20px 0; display: inline-block; vertical-align: middle; width: 100%;"
>
<a
target="_blank"
href="https://pikwizard.com/photo/financial-graph-overlaying-retail-store-backdrop-visualizing-market-trends/4bb1a66f6a0278fe714dd524bb87a5f4/"
style="text-decoration: none; font-size: 10px; margin: 0;"
>
<img src="https://pikwizard.com/pw/medium/4bb1a66f6a0278fe714dd524bb87a5f4.jpg" style="margin: 0; width: 100%;" alt="" />
<p style="font-size: 12px; margin: 0;">PikWizard</p>
</a>
</span>
</span>
Free (free of charge)
Free for personal and commercial use.
Author: Awesome Content
Similar Free Stock Images

Premium


Premium


Premium


Premium


Premium


Premium


Premium


Premium


Premium


Premium


Premium


Premium


Premium


Premium


Premium


Premium


Premium


Premium


Premium


Premium


Premium


Premium


Premium


Premium


Premium

