- Home >
- Stock Photos >
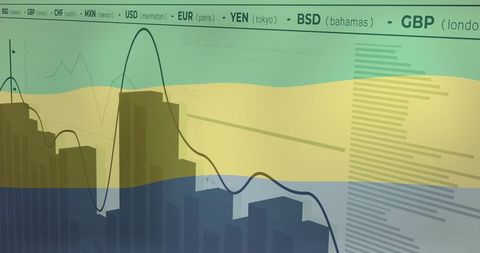
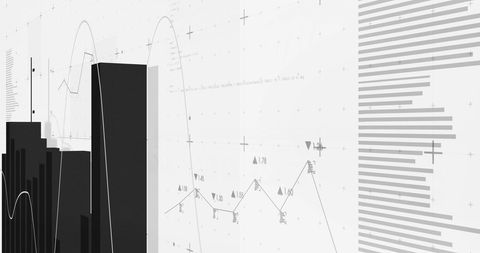
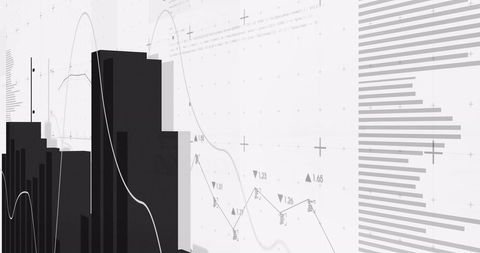
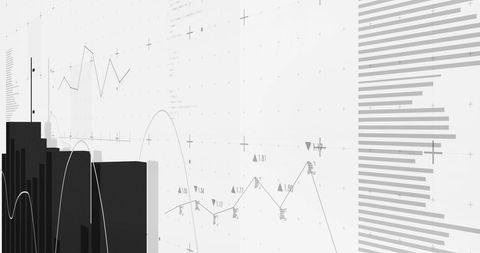
- Financial Graphs with 3D Bars and Data Lines on White Background
Financial Graphs with 3D Bars and Data Lines on White Background Image

Financial image featuring 3D bar graphs and dynamic line charts against a minimalist white background. Suitable for illustrating business analysis, marketing presentations, financial reports, and technology-focused articles. Ideal for visualizing complex data trends in stock market and global business communications.
Powered by  - Get 15% off with code: PIKWIZARD15


2
downloads
downloads
Tags:
More
Credit Photo
If you would like to credit the Photo, here are some ways you can do so
Text Link
photo Link
<span class="text-link">
<span>
<a target="_blank" href=https://pikwizard.com/photo/financial-graphs-with-3d-bars-and-data-lines-on-white-background/98f50919e8563ebb30d533174cb0f776/>PikWizard</a>
</span>
</span>
<span class="image-link">
<span
style="margin: 0 0 20px 0; display: inline-block; vertical-align: middle; width: 100%;"
>
<a
target="_blank"
href="https://pikwizard.com/photo/financial-graphs-with-3d-bars-and-data-lines-on-white-background/98f50919e8563ebb30d533174cb0f776/"
style="text-decoration: none; font-size: 10px; margin: 0;"
>
<img src="https://pikwizard.com/pw/medium/98f50919e8563ebb30d533174cb0f776.jpg" style="margin: 0; width: 100%;" alt="" />
<p style="font-size: 12px; margin: 0;">PikWizard</p>
</a>
</span>
</span>
Free (free of charge)
Free for personal and commercial use.
Author: Creative Art
Similar Free Stock Images

Premium


Premium


Premium


Premium


Premium


Premium


Premium


Premium


Premium


Premium


Premium


Premium


Premium


Premium


Premium


Premium


Premium


Premium


Premium


Premium


Premium


Premium


Premium


Premium


Premium