- Home >
- Stock Photos >
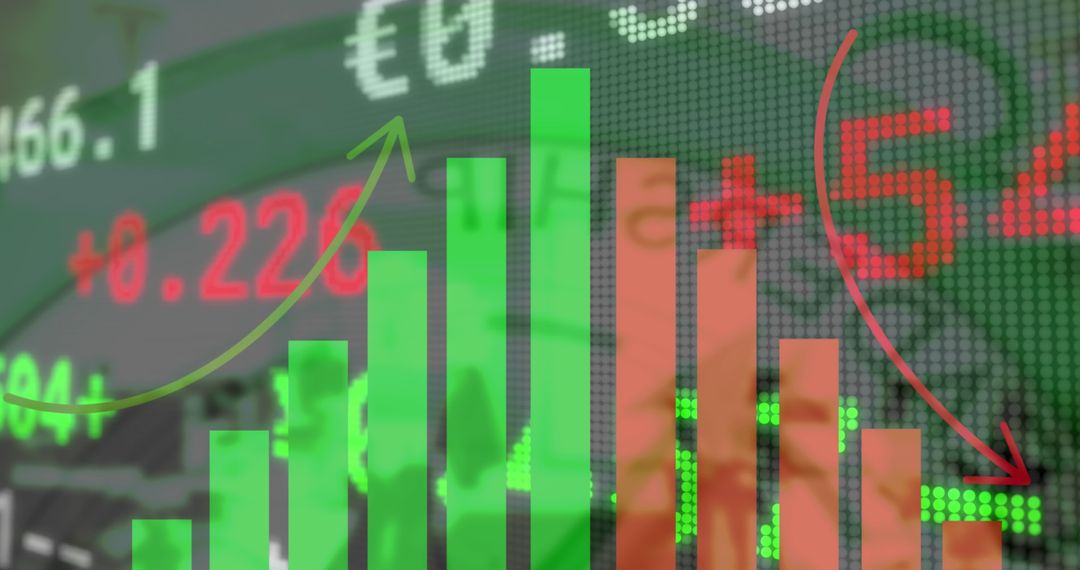
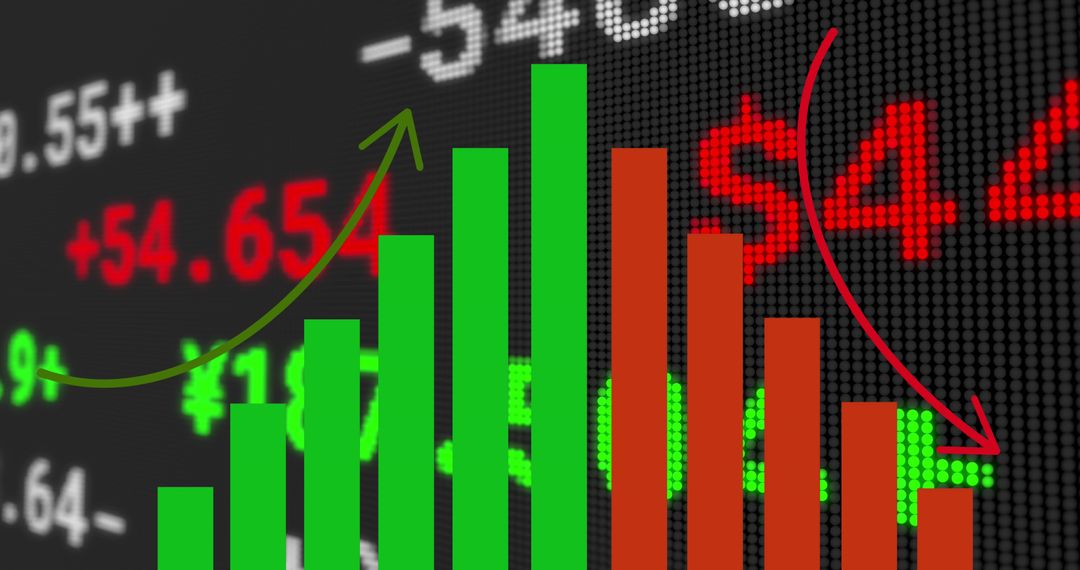
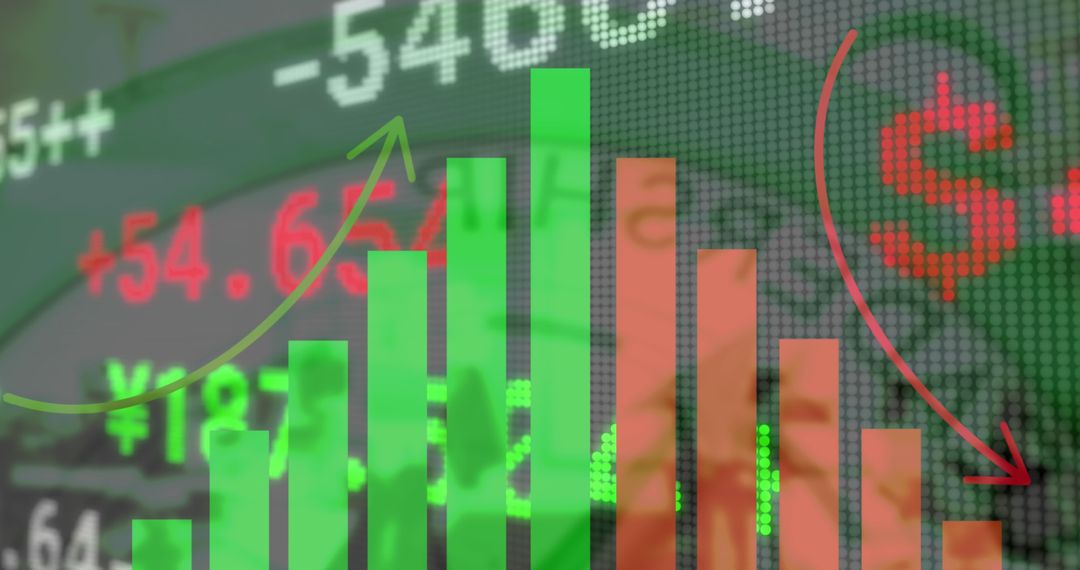
- Financial Growth and Decline with Stock Market Data Visualization
Financial Growth and Decline with Stock Market Data Visualization Image

Illustrates dynamic changes in stock values with green growth bars and brown decline bars over financial ticker background. Ideal for representing investment trends, market analysis, and finance-related content or reports highlighting the volatility and divergence in market activities.
Powered by  - Get 15% off with code: PIKWIZARD15


2
downloads
downloads
Tags:
More
Credit Photo
If you would like to credit the Photo, here are some ways you can do so
Text Link
photo Link
<span class="text-link">
<span>
<a target="_blank" href=https://pikwizard.com/photo/financial-growth-and-decline-with-stock-market-data-visualization/d32e809a4f850670b447b579210ec10f/>PikWizard</a>
</span>
</span>
<span class="image-link">
<span
style="margin: 0 0 20px 0; display: inline-block; vertical-align: middle; width: 100%;"
>
<a
target="_blank"
href="https://pikwizard.com/photo/financial-growth-and-decline-with-stock-market-data-visualization/d32e809a4f850670b447b579210ec10f/"
style="text-decoration: none; font-size: 10px; margin: 0;"
>
<img src="https://pikwizard.com/pw/medium/d32e809a4f850670b447b579210ec10f.jpg" style="margin: 0; width: 100%;" alt="" />
<p style="font-size: 12px; margin: 0;">PikWizard</p>
</a>
</span>
</span>
Free (free of charge)
Free for personal and commercial use.
Author: Authentic Images
Similar Free Stock Images

Premium


Premium


Premium


Premium


Premium


Premium


Premium


Premium


Premium


Premium


Premium


Premium


Premium


Premium


Premium


Premium


Premium


Premium


Premium


Premium


Premium


Premium


Premium


Premium