- Home >
- Stock Photos >
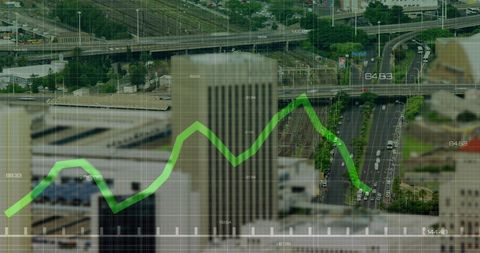
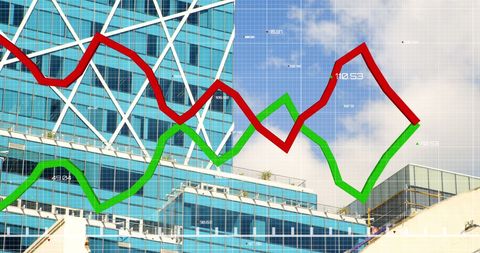
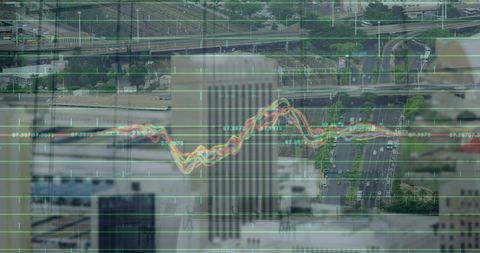
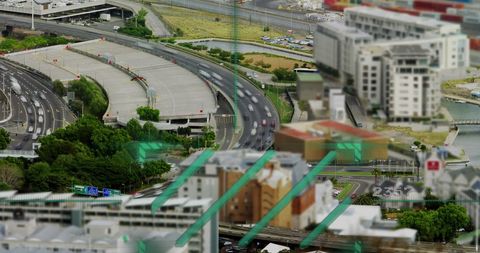
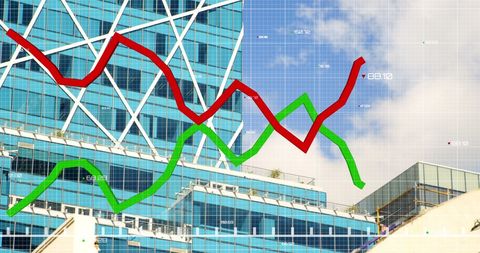
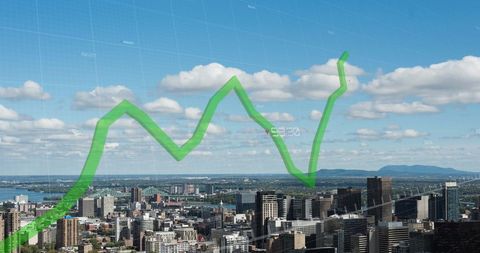
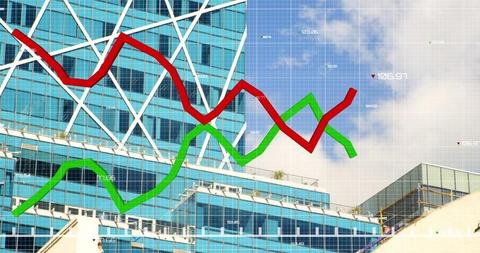
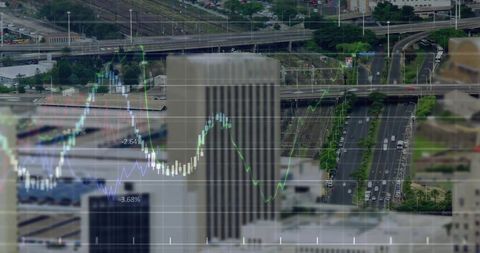
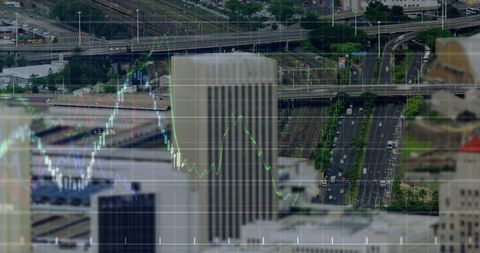
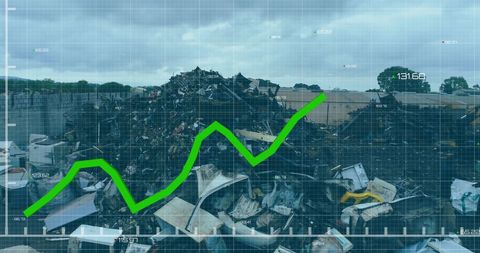
- Financial Growth Chart Over Urban Cityscape Complexity
Financial Growth Chart Over Urban Cityscape Complexity Image
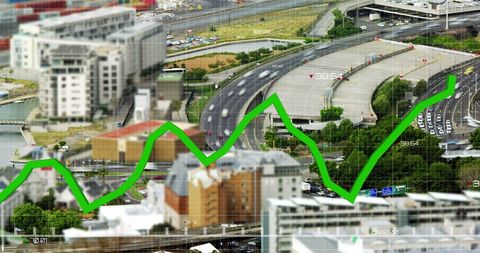
Visual depicts a digital green line chart displayed over a cityscape, illustrating concepts of financial growth and urban economics. Ideal for presentations, articles on financial trends and urban investment, or marketing material concerning digital finance and economic development.
Powered by 


2
downloads
downloads
Tags:
More
Credit Photo
If you would like to credit the Photo, here are some ways you can do so
Text Link
photo Link
<span class="text-link">
<span>
<a target="_blank" href=https://pikwizard.com/photo/financial-growth-chart-over-urban-cityscape-complexity/ce1dcdf26a3a31f2671d5c745ef7ec88/>PikWizard</a>
</span>
</span>
<span class="image-link">
<span
style="margin: 0 0 20px 0; display: inline-block; vertical-align: middle; width: 100%;"
>
<a
target="_blank"
href="https://pikwizard.com/photo/financial-growth-chart-over-urban-cityscape-complexity/ce1dcdf26a3a31f2671d5c745ef7ec88/"
style="text-decoration: none; font-size: 10px; margin: 0;"
>
<img src="https://pikwizard.com/pw/medium/ce1dcdf26a3a31f2671d5c745ef7ec88.jpg" style="margin: 0; width: 100%;" alt="" />
<p style="font-size: 12px; margin: 0;">PikWizard</p>
</a>
</span>
</span>
Free (free of charge)
Free for personal and commercial use.
Author: Awesome Content
Similar Free Stock Images
Premium


Premium


Premium


Premium


Premium


Premium


Premium


Premium


Premium


Premium


Premium


Premium


Premium


Premium


Premium


Premium


Premium


Premium


Premium


Premium


Premium


Premium


Premium


Premium


Premium