
- Home >
- Stock Photos >
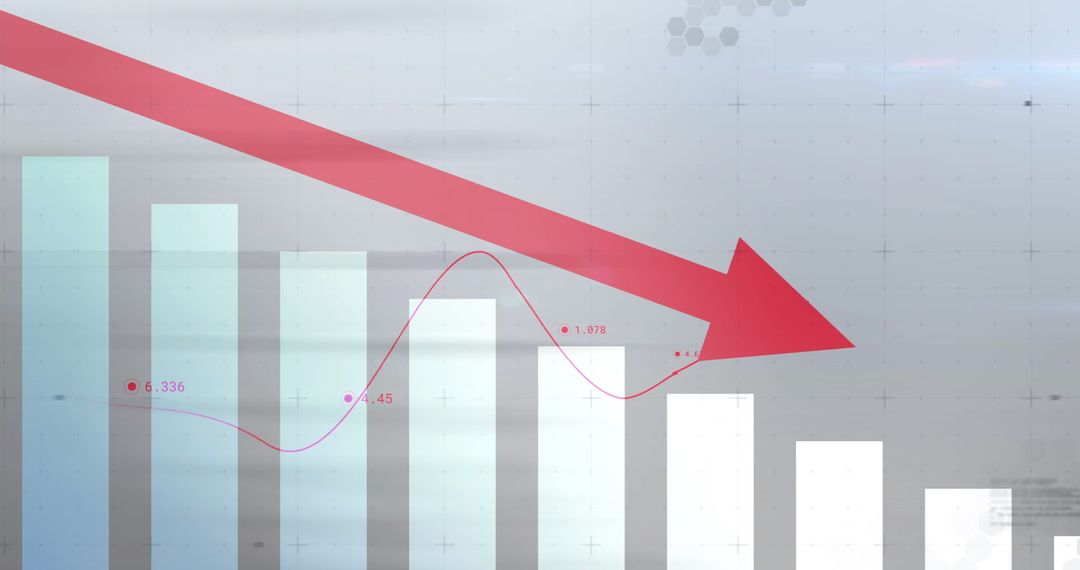
- Financial Growth Concept with Data Charts and Arrow Overlay
Financial Growth Concept with Data Charts and Arrow Overlay Image

Illustration featuring financial charts and graphs with an upward arrow indicating growth. The soft-focus city lights suggest a blend of data-driven business growth in an urban setting. Useful for business presentations on market trends, investment strategies, or economic forecasts. Ideal for newsletters emphasizing financial planning and guides relating to successful business management or economic expansion.
Powered by  - Get 15% off with code: PIKWIZARD15


2
downloads
downloads
Tags:
More
Credit Photo
If you would like to credit the Photo, here are some ways you can do so
Text Link
photo Link
<span class="text-link">
<span>
<a target="_blank" href=https://pikwizard.com/photo/financial-growth-concept-with-data-charts-and-arrow-overlay/2f50f2ab743ebf327fca83d9acfea6e2/>PikWizard</a>
</span>
</span>
<span class="image-link">
<span
style="margin: 0 0 20px 0; display: inline-block; vertical-align: middle; width: 100%;"
>
<a
target="_blank"
href="https://pikwizard.com/photo/financial-growth-concept-with-data-charts-and-arrow-overlay/2f50f2ab743ebf327fca83d9acfea6e2/"
style="text-decoration: none; font-size: 10px; margin: 0;"
>
<img src="https://pikwizard.com/pw/medium/2f50f2ab743ebf327fca83d9acfea6e2.jpg" style="margin: 0; width: 100%;" alt="" />
<p style="font-size: 12px; margin: 0;">PikWizard</p>
</a>
</span>
</span>
Free (free of charge)
Free for personal and commercial use.
Author: Authentic Images
Similar Free Stock Images

Premium


Premium


Premium


Premium


Premium


Premium


Premium


Premium


Premium


Premium


Premium


Premium


Premium


Premium


Premium


Premium


Premium


Premium


Premium


Premium


Premium


Premium


Premium


Premium

