
- Home >
- Stock Photos >
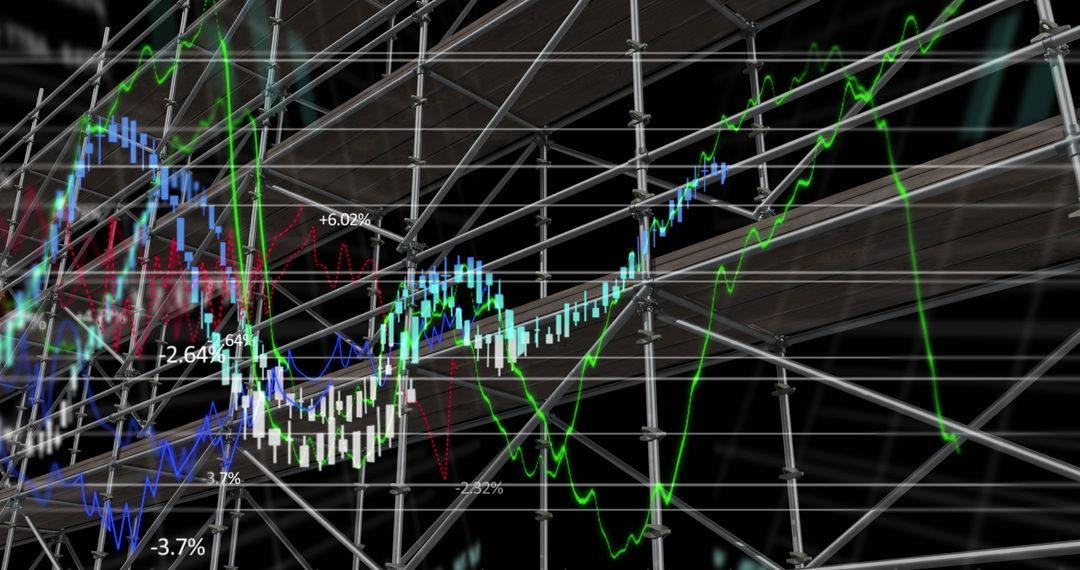
- Financial Growth Depiction with Digital Chart and Scaffolding
Financial Growth Depiction with Digital Chart and Scaffolding Image

Depicts overlay of scaffolding structure with financial data graphs. Useful for illustrating financial growth strategies, technological advancements, investment opportunities, and economic analytics. Suitable for presentations, financial news articles, and educational materials focusing on business development.
Powered by  - Get 15% off with code: PIKWIZARD15


2
downloads
downloads
Tags:
More
Credit Photo
If you would like to credit the Photo, here are some ways you can do so
Text Link
photo Link
<span class="text-link">
<span>
<a target="_blank" href=https://pikwizard.com/photo/financial-growth-depiction-with-digital-chart-and-scaffolding/8f8d177d61e432ea60ed7fdcae2bc530/>PikWizard</a>
</span>
</span>
<span class="image-link">
<span
style="margin: 0 0 20px 0; display: inline-block; vertical-align: middle; width: 100%;"
>
<a
target="_blank"
href="https://pikwizard.com/photo/financial-growth-depiction-with-digital-chart-and-scaffolding/8f8d177d61e432ea60ed7fdcae2bc530/"
style="text-decoration: none; font-size: 10px; margin: 0;"
>
<img src="https://pikwizard.com/pw/medium/8f8d177d61e432ea60ed7fdcae2bc530.jpg" style="margin: 0; width: 100%;" alt="" />
<p style="font-size: 12px; margin: 0;">PikWizard</p>
</a>
</span>
</span>
Free (free of charge)
Free for personal and commercial use.
Author: Awesome Content
Similar Free Stock Images

Premium


Premium


Premium


Premium


Premium


Premium


Premium


Premium


Premium


Premium


Premium


Premium


Premium


Premium


Premium


Premium


Premium


Premium


Premium


Premium


Premium


Premium


Premium


Premium

