- Home >
- Stock Photos >
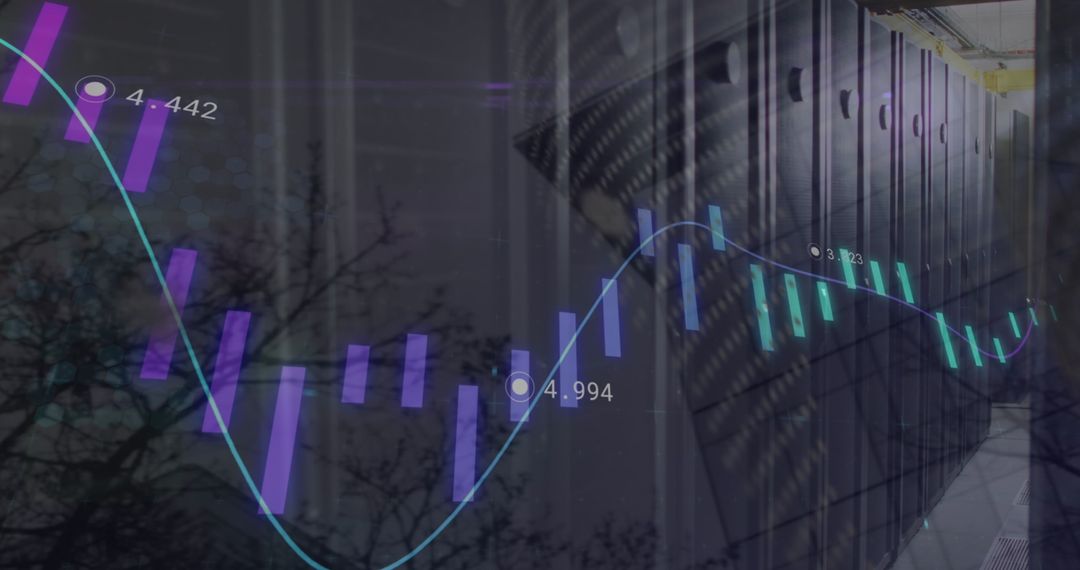
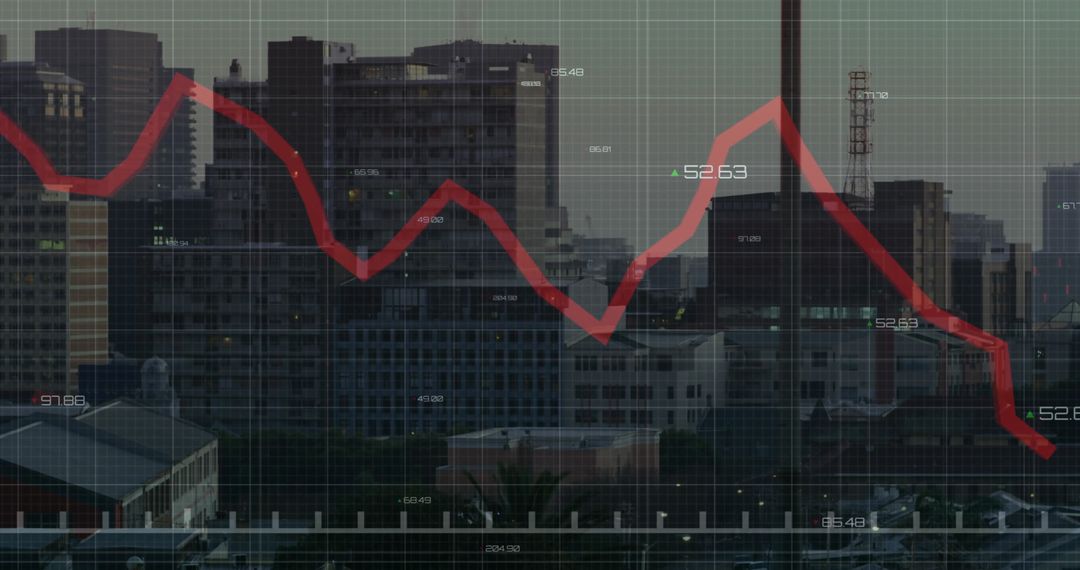
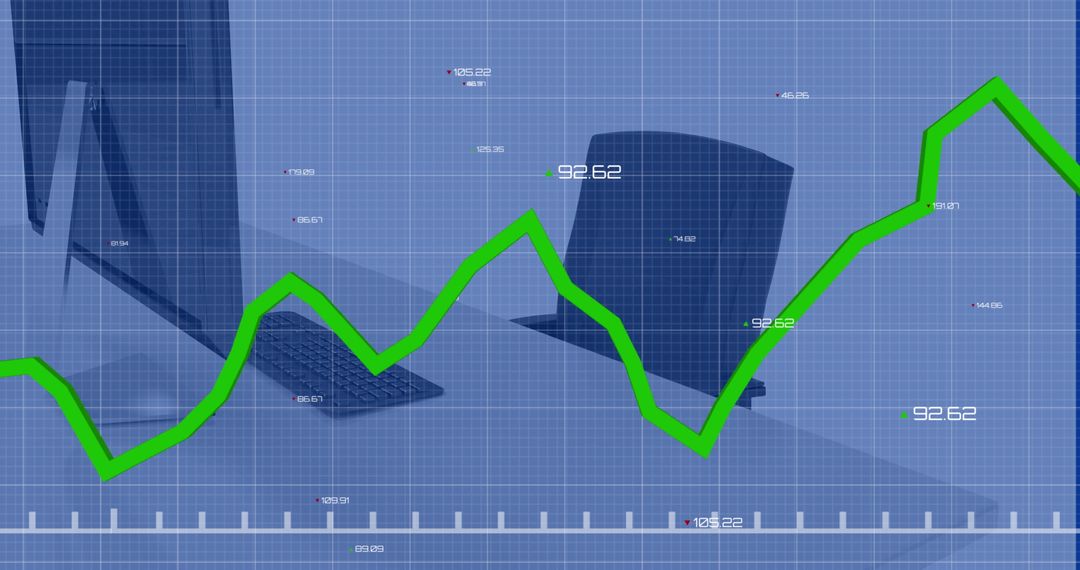
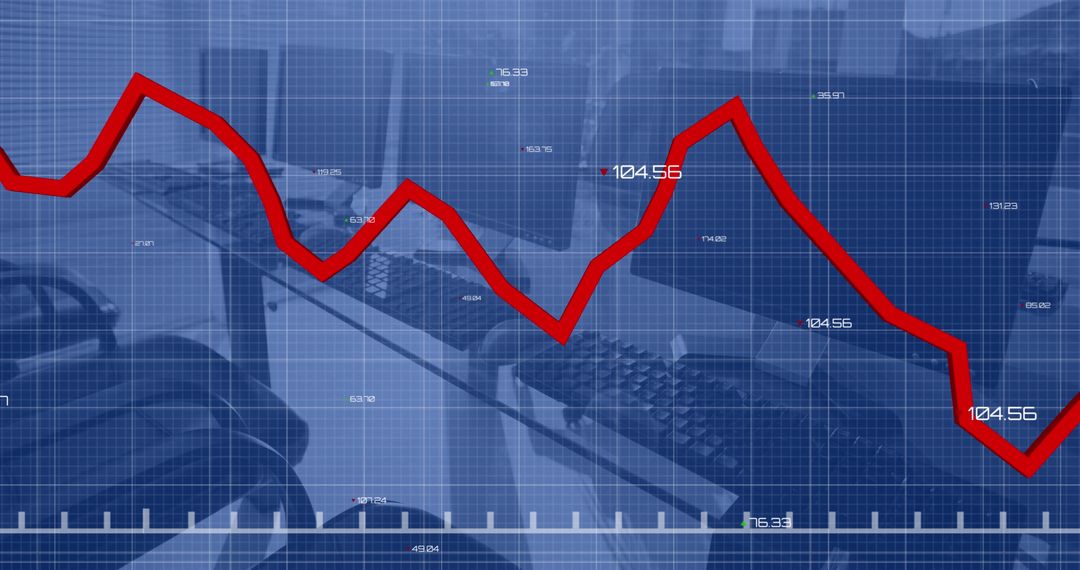
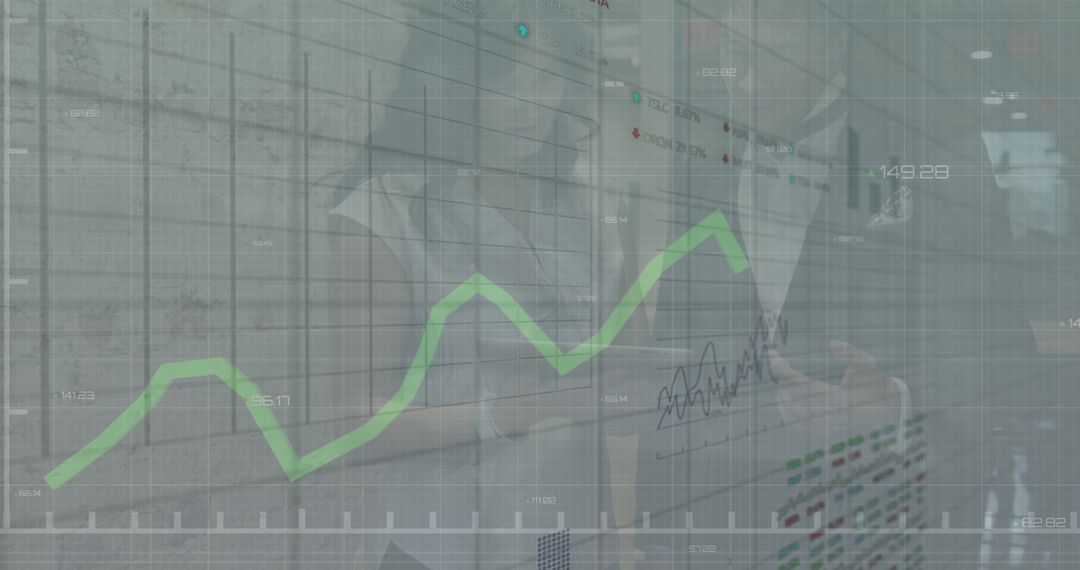
- Financial Growth Graph Overlay on Server Room Infrastructure
Financial Growth Graph Overlay on Server Room Infrastructure Image

Illustrating business growth and technological advancement, this digital composite shows a rising financial graph superimposed over a server room. Ideal for use in business reports, presentations on networking technology, or financial analyses, this visual represents modern analytics and infrastructure growth.
Powered by 


2
downloads
downloads
Tags:
More
Credit Photo
If you would like to credit the Photo, here are some ways you can do so
Text Link
photo Link
<span class="text-link">
<span>
<a target="_blank" href=https://pikwizard.com/photo/financial-growth-graph-overlay-on-server-room-infrastructure/80d1c65947cdc2c5a4e92e4454b521c0/>PikWizard</a>
</span>
</span>
<span class="image-link">
<span
style="margin: 0 0 20px 0; display: inline-block; vertical-align: middle; width: 100%;"
>
<a
target="_blank"
href="https://pikwizard.com/photo/financial-growth-graph-overlay-on-server-room-infrastructure/80d1c65947cdc2c5a4e92e4454b521c0/"
style="text-decoration: none; font-size: 10px; margin: 0;"
>
<img src="https://pikwizard.com/pw/medium/80d1c65947cdc2c5a4e92e4454b521c0.jpg" style="margin: 0; width: 100%;" alt="" />
<p style="font-size: 12px; margin: 0;">PikWizard</p>
</a>
</span>
</span>
Free (free of charge)
Free for personal and commercial use.
Author: Authentic Images
Similar Free Stock Images

Premium


Premium


Premium


Premium


Premium


Premium


Premium


Premium


Premium


Premium


Premium


Premium


Premium


Premium


Premium


Premium


Premium


Premium


Premium


Premium


Premium


Premium


Premium


Premium