
- Home >
- Stock Photos >
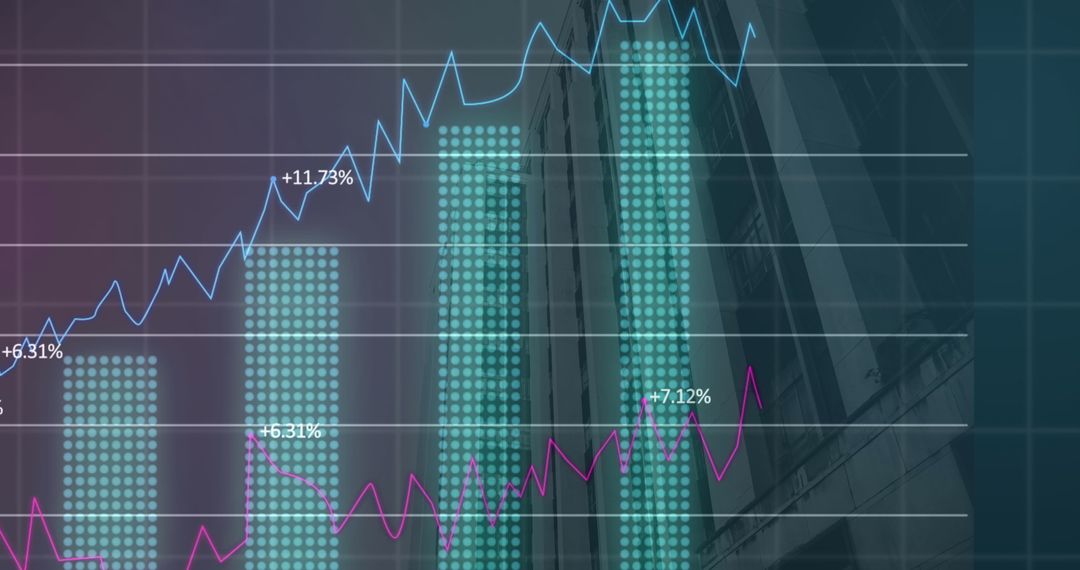
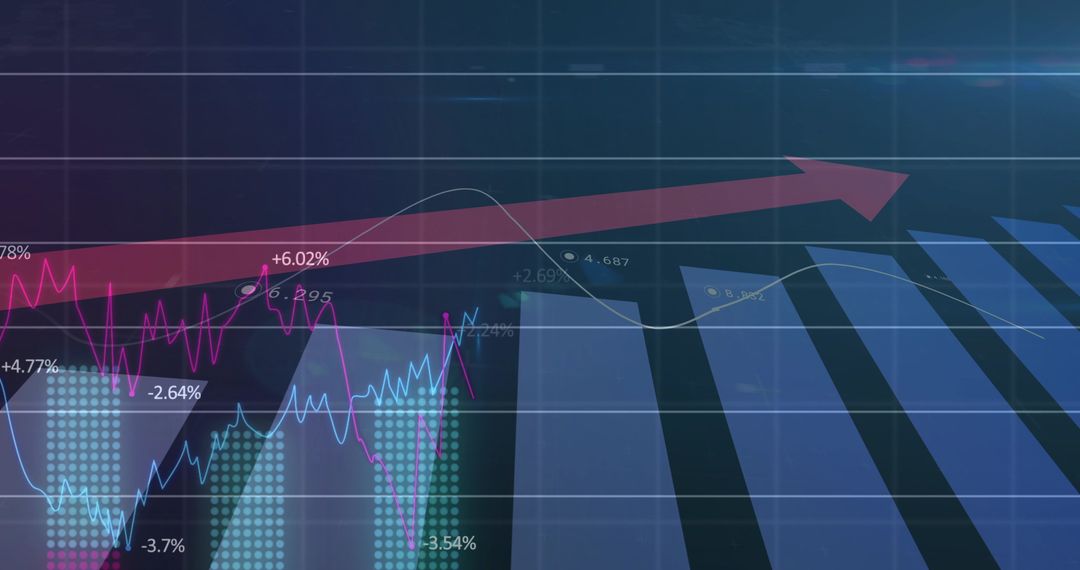
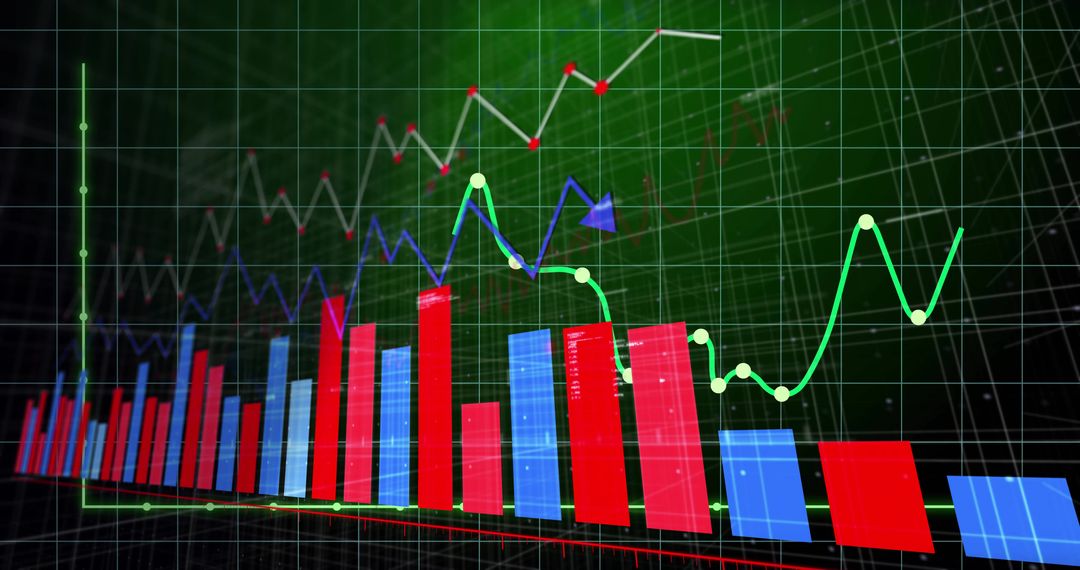
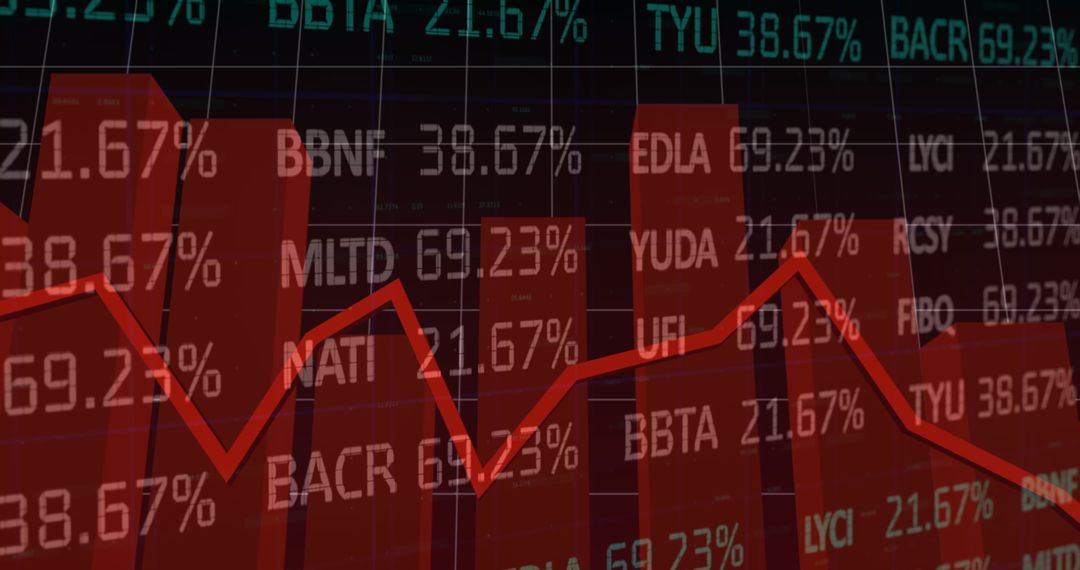
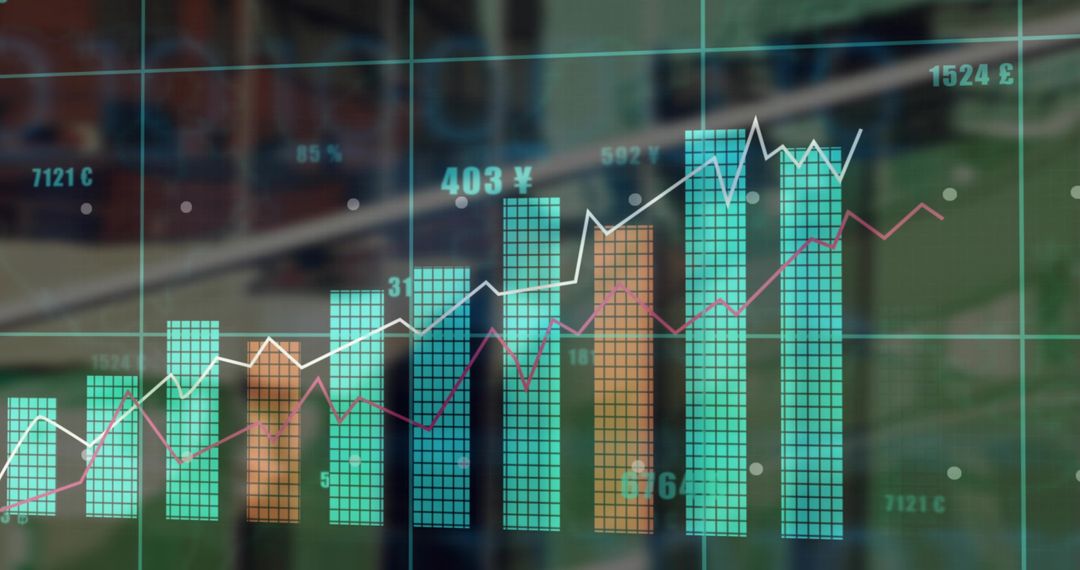
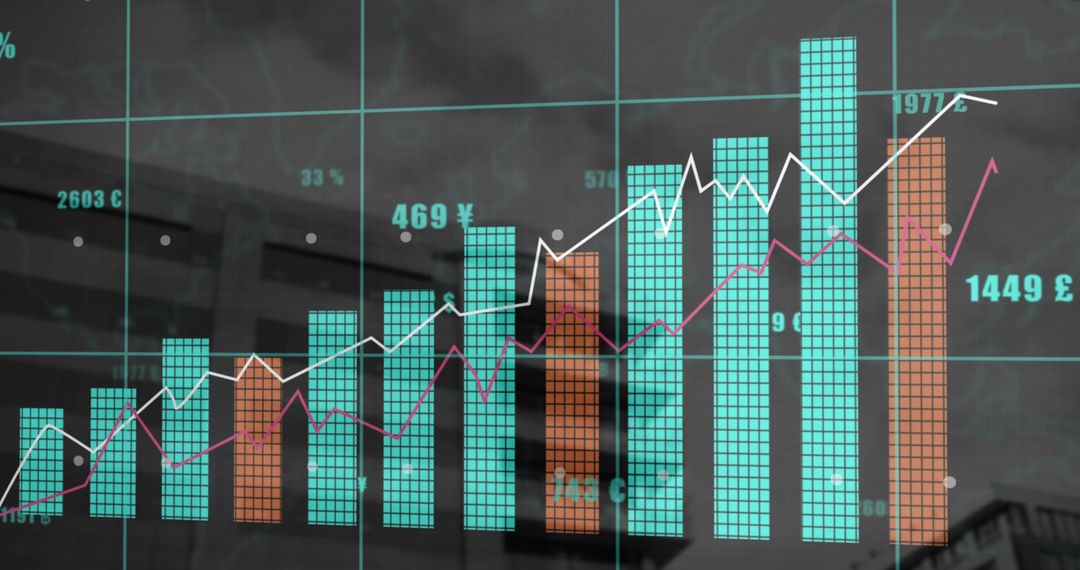
- Financial Market Analysis Dashboard with Graphs and Charts
Financial Market Analysis Dashboard with Graphs and Charts Image
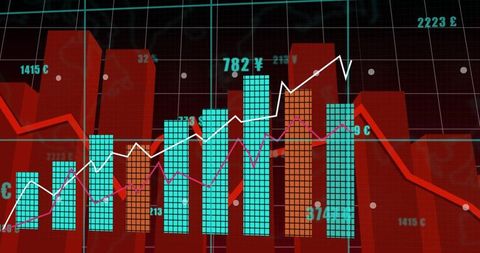
Dynamic visual representation showcases financial market analysis featuring bar graphs, line charts, and data points. Ideal for illustrating reports on economic trends, demonstrating analytics in action, or enhancing presentations about data monitoring and technology in finance.
Powered by  - Get 15% off with code: PIKWIZARD15


0
downloads
downloads
Tags:
More
Credit Photo
If you would like to credit the Photo, here are some ways you can do so
Text Link
photo Link
<span class="text-link">
<span>
<a target="_blank" href=https://pikwizard.com/photo/financial-market-analysis-dashboard-with-graphs-and-charts/5b52c3fd22e73ac4b7977ea0f9f50d28/>PikWizard</a>
</span>
</span>
<span class="image-link">
<span
style="margin: 0 0 20px 0; display: inline-block; vertical-align: middle; width: 100%;"
>
<a
target="_blank"
href="https://pikwizard.com/photo/financial-market-analysis-dashboard-with-graphs-and-charts/5b52c3fd22e73ac4b7977ea0f9f50d28/"
style="text-decoration: none; font-size: 10px; margin: 0;"
>
<img src="https://pikwizard.com/pw/medium/5b52c3fd22e73ac4b7977ea0f9f50d28.jpg" style="margin: 0; width: 100%;" alt="" />
<p style="font-size: 12px; margin: 0;">PikWizard</p>
</a>
</span>
</span>
Free (free of charge)
Free for personal and commercial use.
Author: People Creations
Similar Free Stock Images

Premium


Premium


Premium


Premium


Premium


Premium


Premium


Premium


Premium


Premium


Premium


Premium


Premium


Premium


Premium


Premium


Premium


Premium


Premium


Premium


Premium


Premium


Premium


Premium

