
- Home >
- Stock Photos >
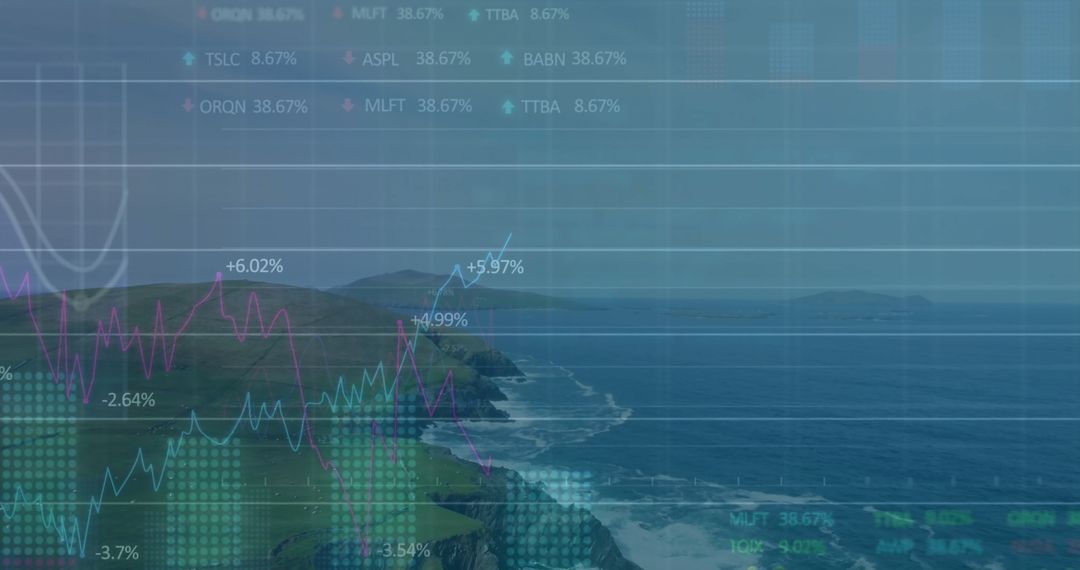
- Financial Market Data Visualization with Line Graphs and Currency Symbols
Financial Market Data Visualization with Line Graphs and Currency Symbols Image

Dynamic display of financial market data using digital technology. Features include red and blue line graphs representing trends with various currency symbols, emphasizing finance analytics. Useful for illustrating topics on economic trends, data analysis, and technology in business publications, presentations, and websites.
Powered by  - Get 15% off with code: PIKWIZARD15


0
downloads
downloads
Tags:
More
Credit Photo
If you would like to credit the Photo, here are some ways you can do so
Text Link
photo Link
<span class="text-link">
<span>
<a target="_blank" href=https://pikwizard.com/photo/financial-market-data-visualization-with-line-graphs-and-currency-symbols/e52ff8d533f527240c056e6b3756aaaa/>PikWizard</a>
</span>
</span>
<span class="image-link">
<span
style="margin: 0 0 20px 0; display: inline-block; vertical-align: middle; width: 100%;"
>
<a
target="_blank"
href="https://pikwizard.com/photo/financial-market-data-visualization-with-line-graphs-and-currency-symbols/e52ff8d533f527240c056e6b3756aaaa/"
style="text-decoration: none; font-size: 10px; margin: 0;"
>
<img src="https://pikwizard.com/pw/medium/e52ff8d533f527240c056e6b3756aaaa.jpg" style="margin: 0; width: 100%;" alt="" />
<p style="font-size: 12px; margin: 0;">PikWizard</p>
</a>
</span>
</span>
Free (free of charge)
Free for personal and commercial use.
Author: Awesome Content
Similar Free Stock Images

Premium


Premium


Premium


Premium


Premium


Premium


Premium


Premium


Premium


Premium


Premium


Premium


Premium


Premium


Premium


Premium


Premium


Premium


Premium


Premium


Premium


Premium


Premium


Premium

