
- Home >
- Stock Photos >
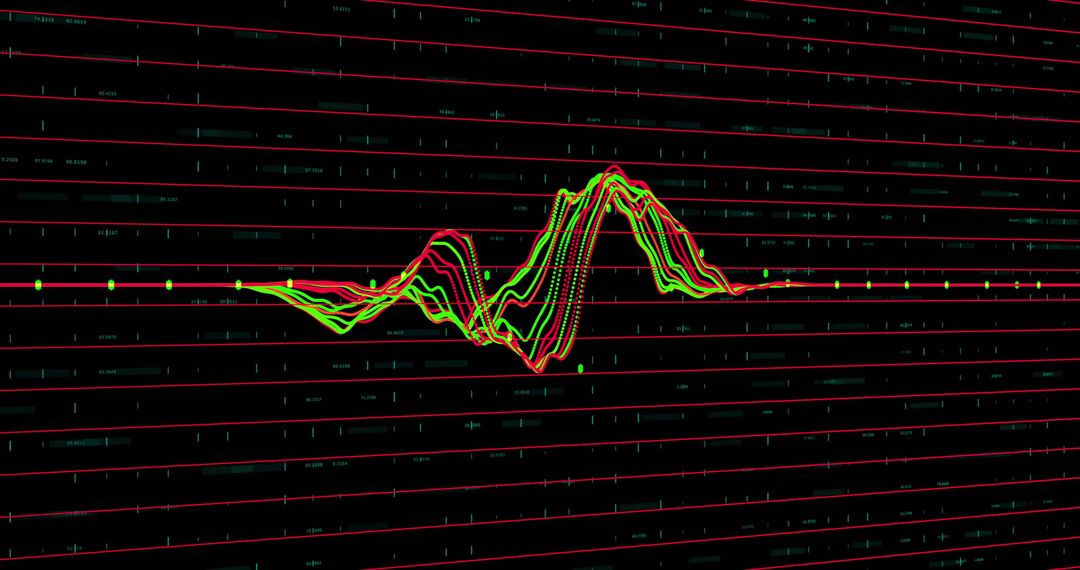
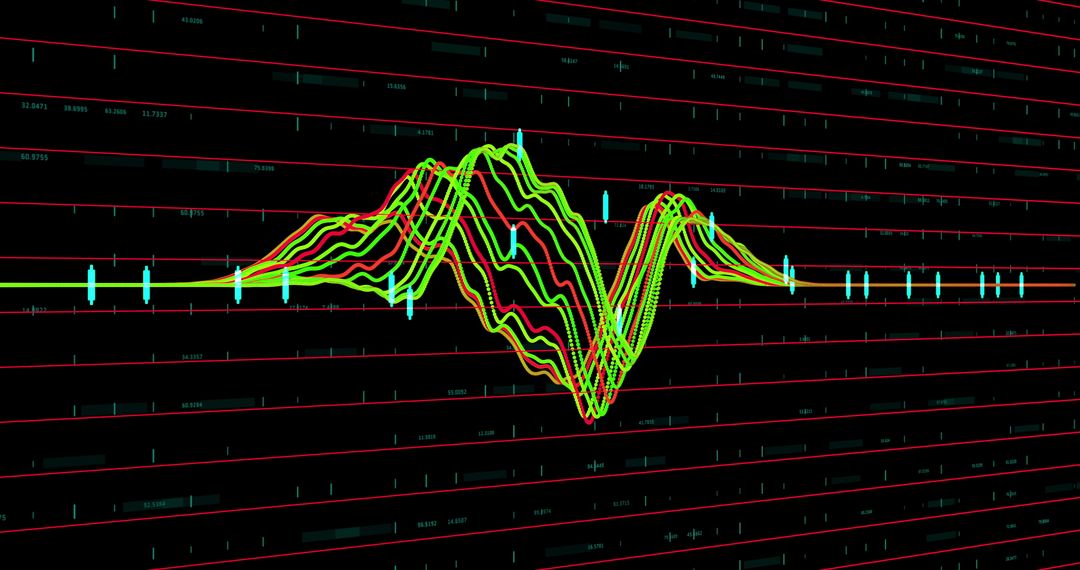
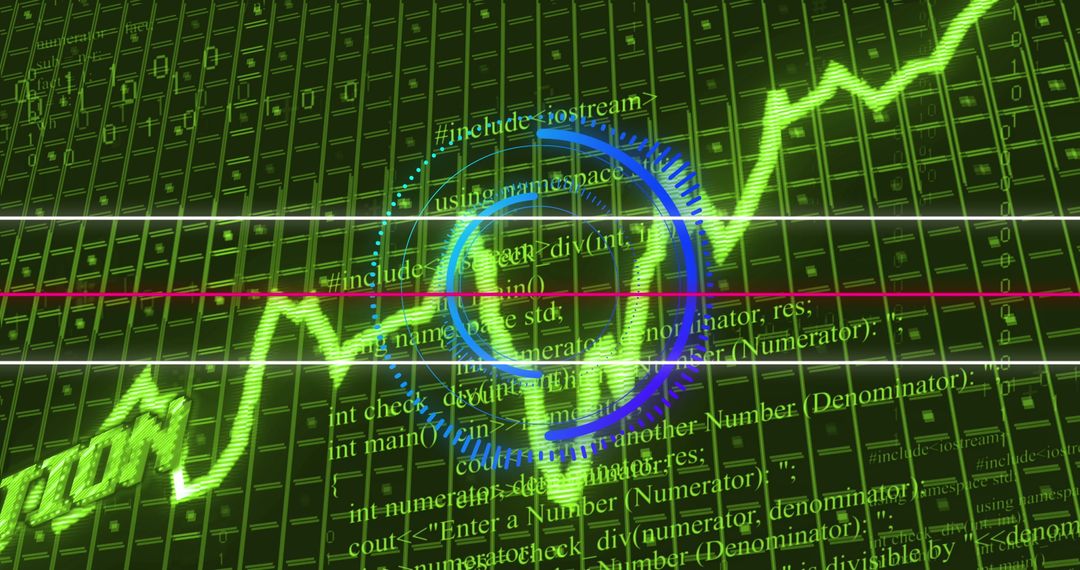
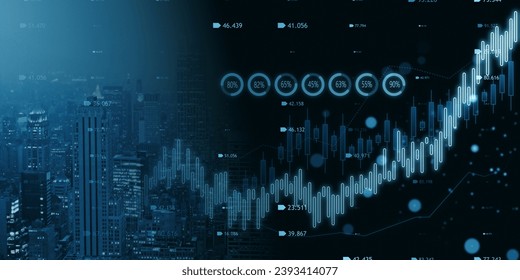
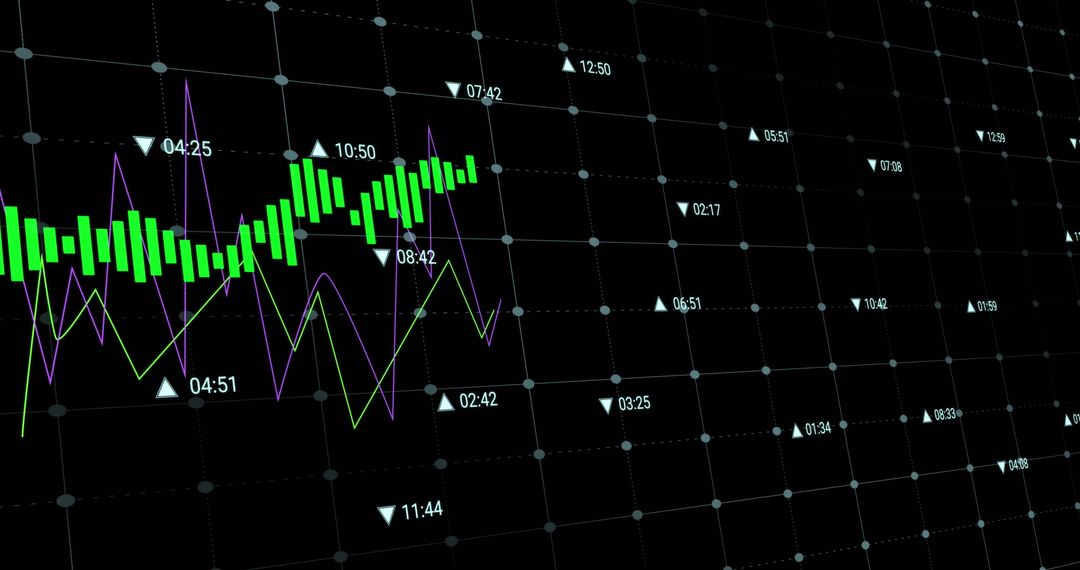
- Financial Market Data with Stock Candlestick Chart and Indicators
Financial Market Data with Stock Candlestick Chart and Indicators Image
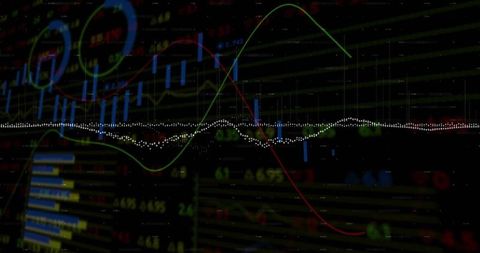
Chart displays financial market data including candlesticks, moving averages, and data markers. Useful for stock traders, financial analysts, or educational purposes, showcasing investment opportunities and market trends in workshops, presentations, or online trading platforms.
Powered by  - Get 15% off with code: PIKWIZARD15


0
downloads
downloads
Tags:
More
Credit Photo
If you would like to credit the Photo, here are some ways you can do so
Text Link
photo Link
<span class="text-link">
<span>
<a target="_blank" href=https://pikwizard.com/photo/financial-market-data-with-stock-candlestick-chart-and-indicators/b1feaa4e91798e18f506aa2b161b6bc1/>PikWizard</a>
</span>
</span>
<span class="image-link">
<span
style="margin: 0 0 20px 0; display: inline-block; vertical-align: middle; width: 100%;"
>
<a
target="_blank"
href="https://pikwizard.com/photo/financial-market-data-with-stock-candlestick-chart-and-indicators/b1feaa4e91798e18f506aa2b161b6bc1/"
style="text-decoration: none; font-size: 10px; margin: 0;"
>
<img src="https://pikwizard.com/pw/medium/b1feaa4e91798e18f506aa2b161b6bc1.jpg" style="margin: 0; width: 100%;" alt="" />
<p style="font-size: 12px; margin: 0;">PikWizard</p>
</a>
</span>
</span>
Free (free of charge)
Free for personal and commercial use.
Author: Authentic Images
Similar Free Stock Images
Premium


Premium


Premium


Premium


Premium


Premium


Premium


Premium


Premium


Premium


Premium


Premium


Premium


Premium


Premium


Premium


Premium


Premium


Premium


Premium


Premium


Premium


Premium


Premium

