- Home >
- Stock Photos >
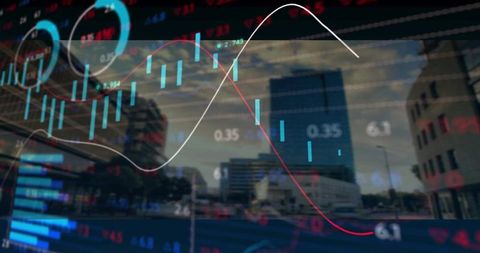
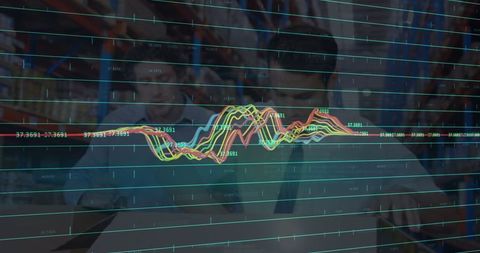
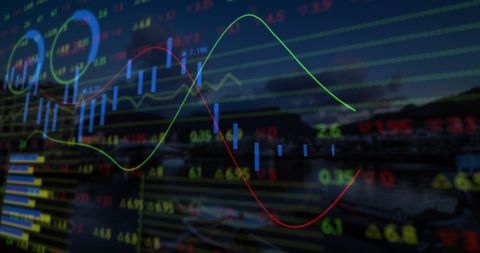
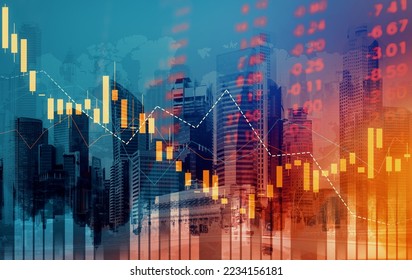
- Financial Market Trends with Candlestick Analysis and Trend Lines
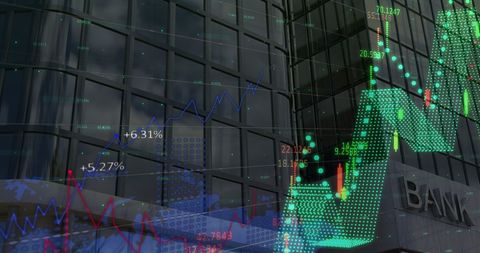
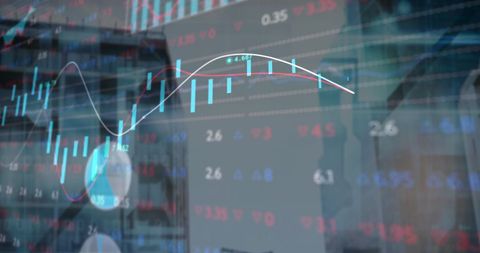
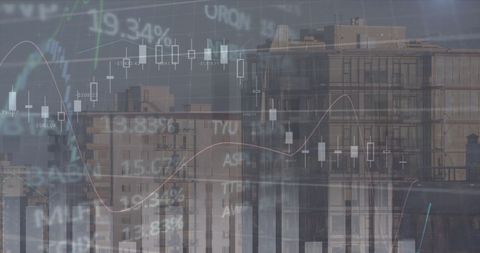
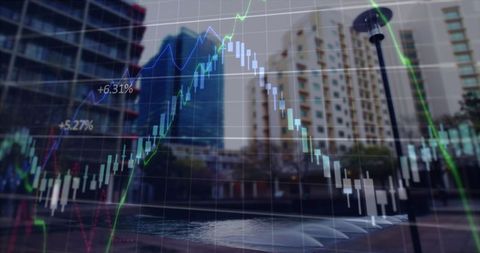
Financial Market Trends with Candlestick Analysis and Trend Lines Image
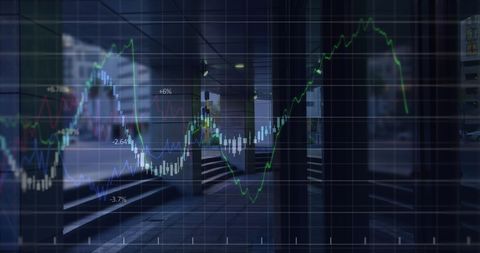
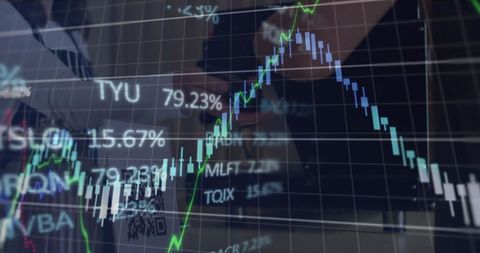
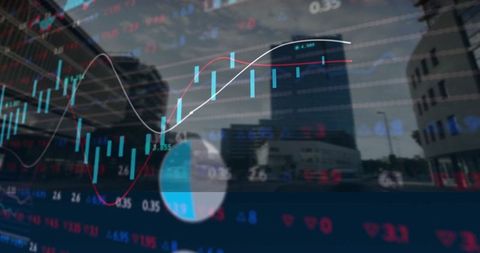
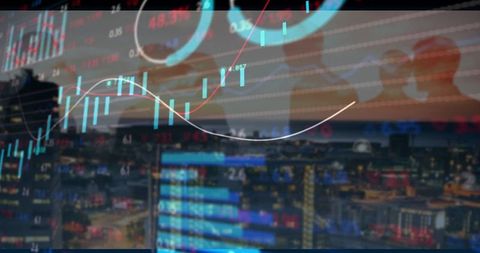
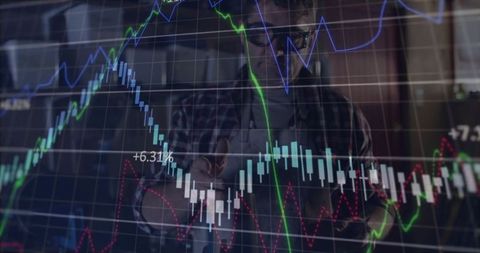
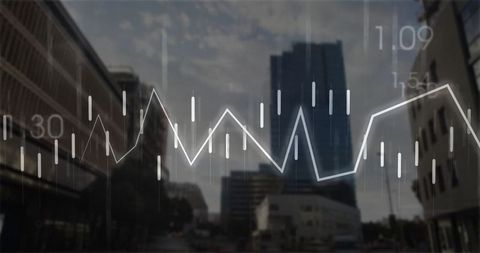
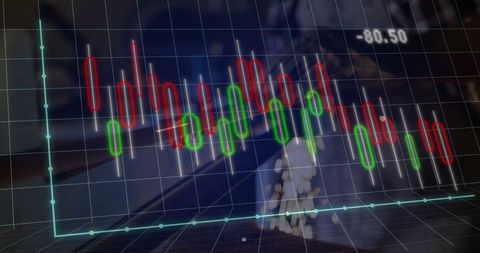
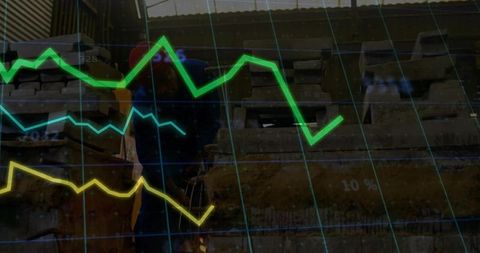
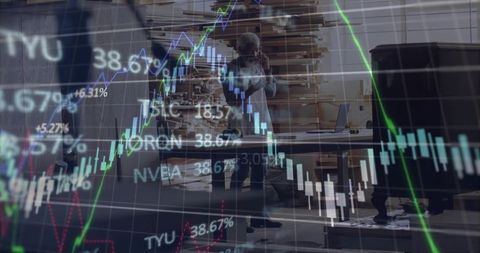
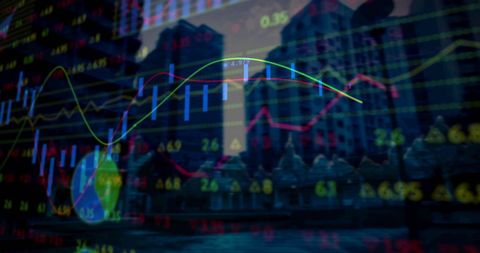
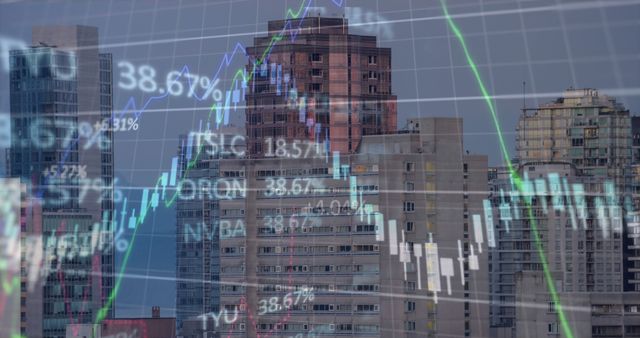
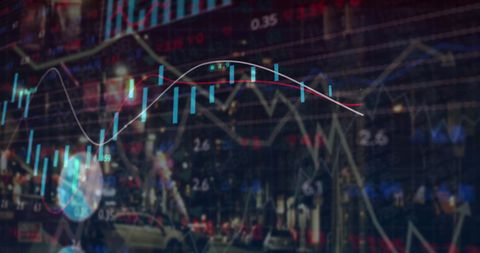
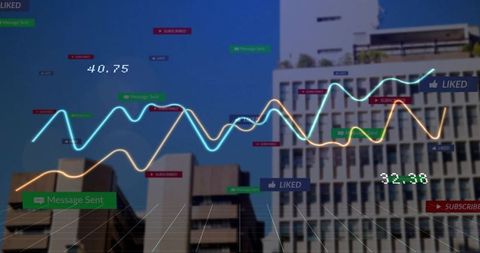
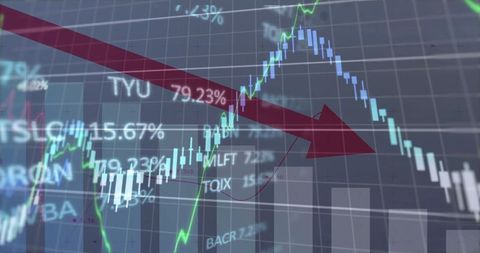
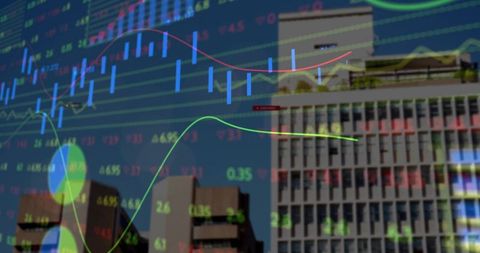
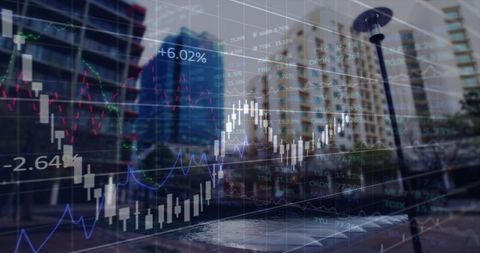
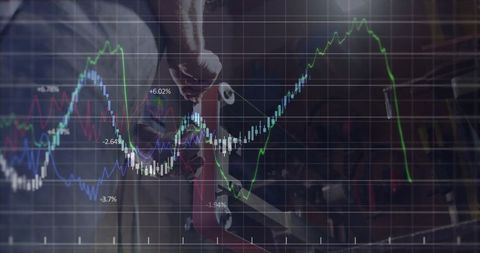
Visualizing stock market data with clear blue candlestick bars overlaid with red and white trend lines, indicating fluctuating trends likely used for investment analysis. Suitable for presentations about financial data analysis, investment strategies, or educational materials on stock trading and market prediction.
Powered by  - Get 15% off with code: PIKWIZARD15


0
downloads
downloads
Tags:
More
Credit Photo
If you would like to credit the Photo, here are some ways you can do so
Text Link
photo Link
<span class="text-link">
<span>
<a target="_blank" href=https://pikwizard.com/photo/financial-market-trends-with-candlestick-analysis-and-trend-lines/2abf6809cc5a30b352040b6bcc1ea8d4/>PikWizard</a>
</span>
</span>
<span class="image-link">
<span
style="margin: 0 0 20px 0; display: inline-block; vertical-align: middle; width: 100%;"
>
<a
target="_blank"
href="https://pikwizard.com/photo/financial-market-trends-with-candlestick-analysis-and-trend-lines/2abf6809cc5a30b352040b6bcc1ea8d4/"
style="text-decoration: none; font-size: 10px; margin: 0;"
>
<img src="https://pikwizard.com/pw/medium/2abf6809cc5a30b352040b6bcc1ea8d4.jpg" style="margin: 0; width: 100%;" alt="" />
<p style="font-size: 12px; margin: 0;">PikWizard</p>
</a>
</span>
</span>
Free (free of charge)
Free for personal and commercial use.
Author: Creative Art
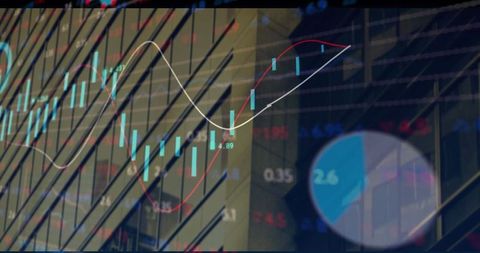
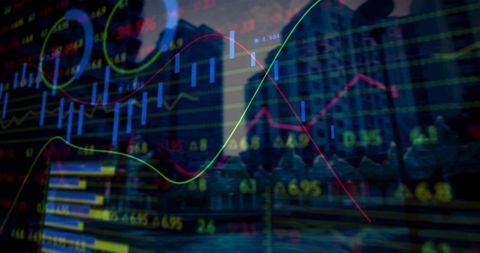
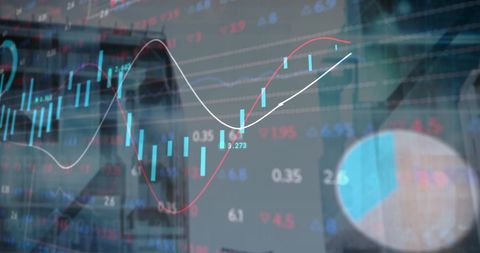
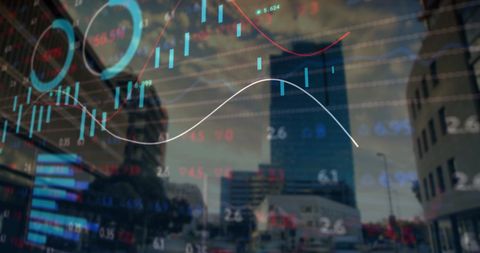
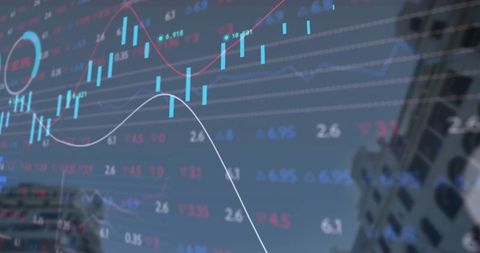
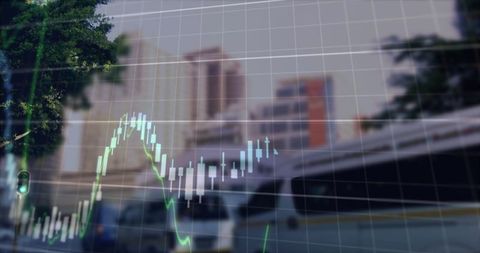
Similar Free Stock Images
Premium


Premium


Premium


Premium


Premium


Premium


Premium

Premium


Premium


Premium


Premium


Premium


Premium


Premium


Premium


Premium


Premium


Premium


Premium


Premium


Premium

Premium


Premium


Premium


Premium