- Home >
- Stock Photos >
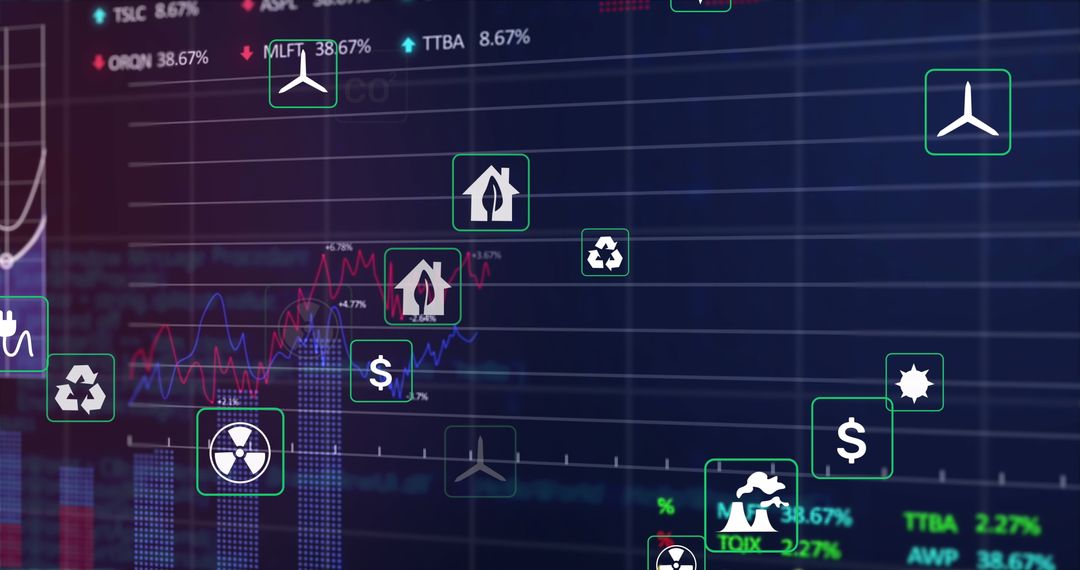
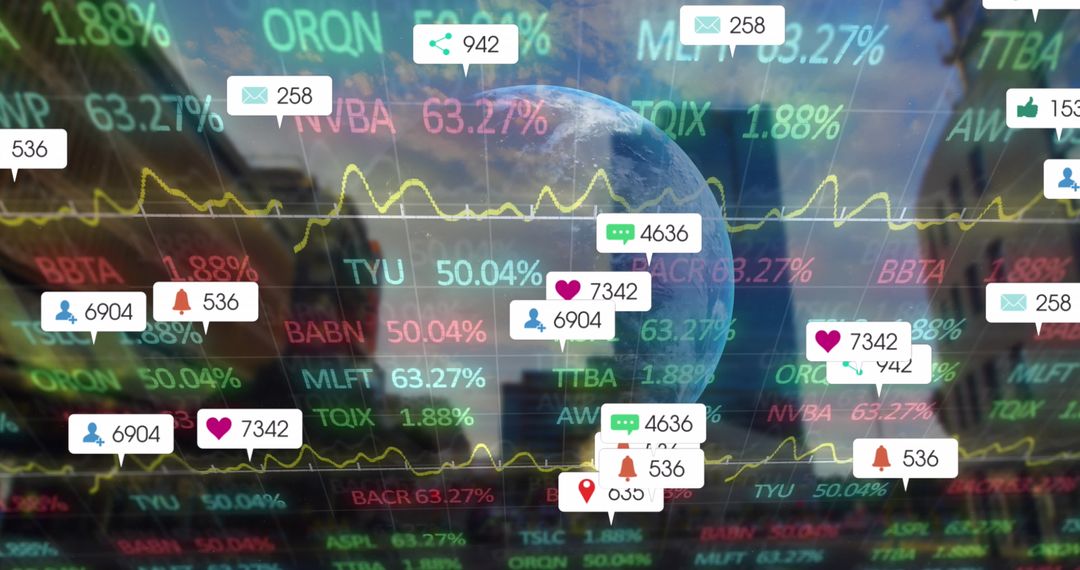
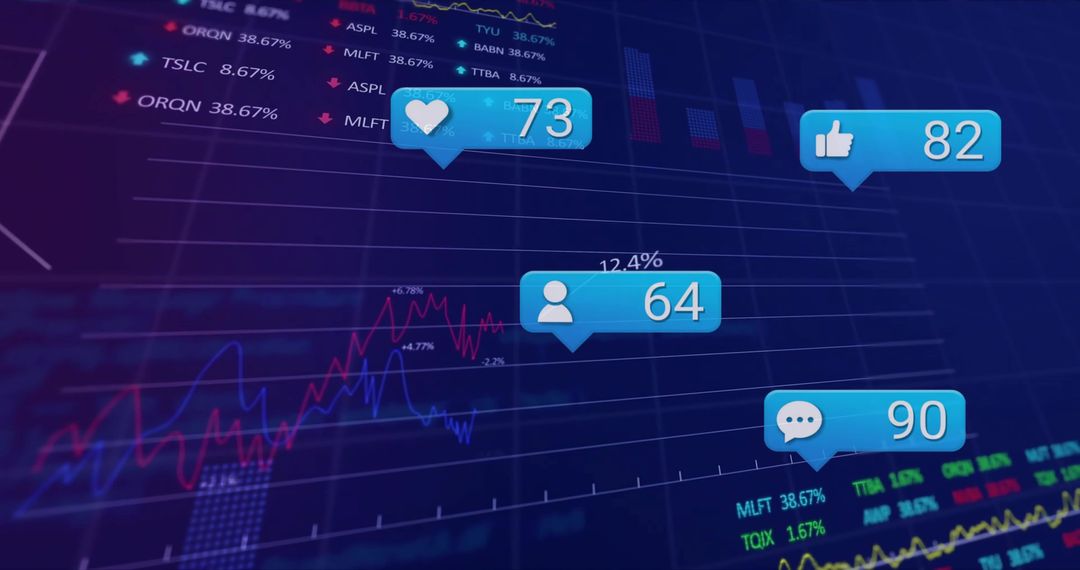
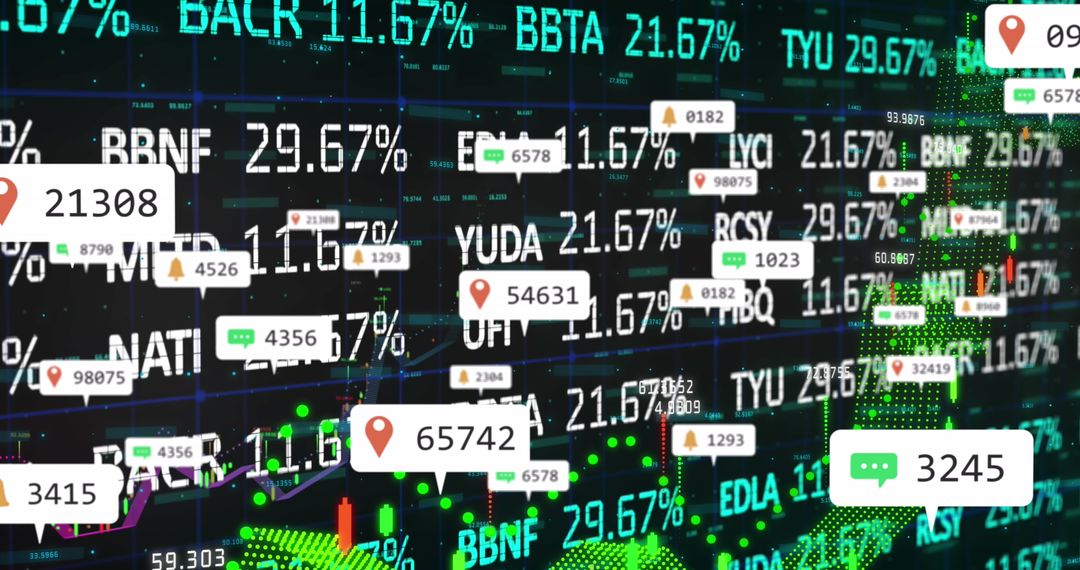
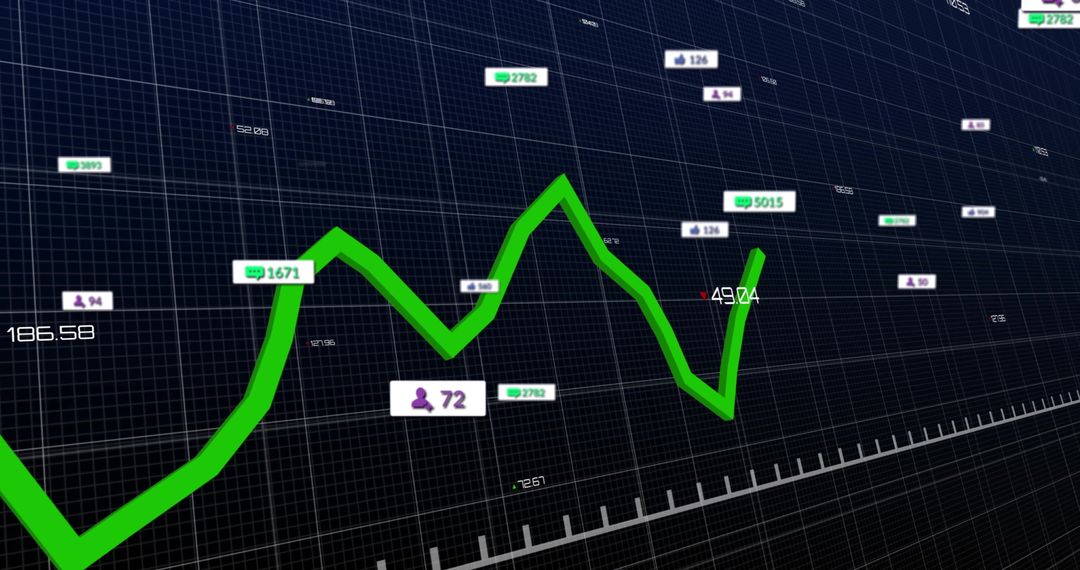
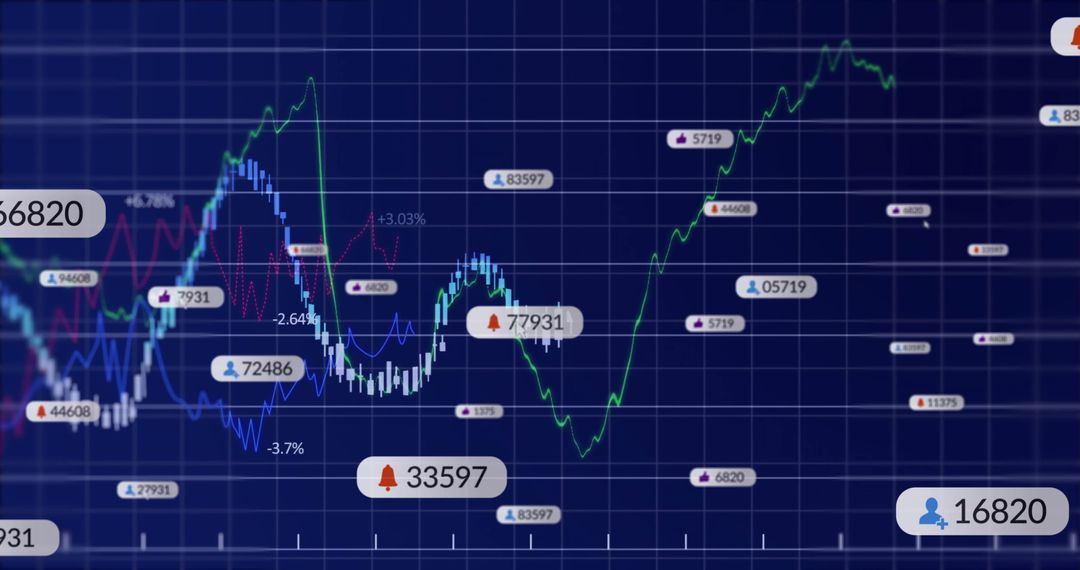
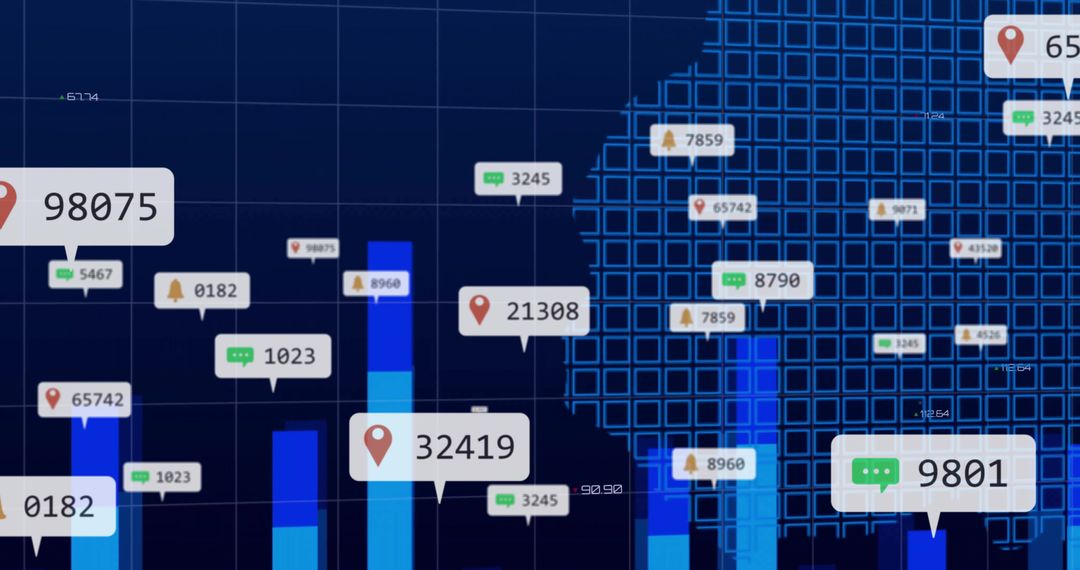
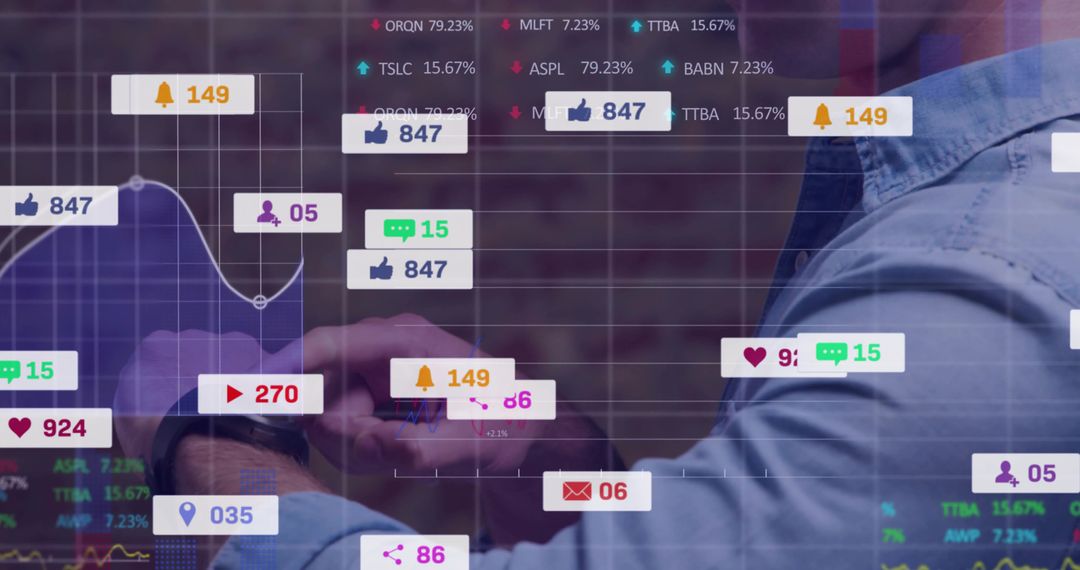
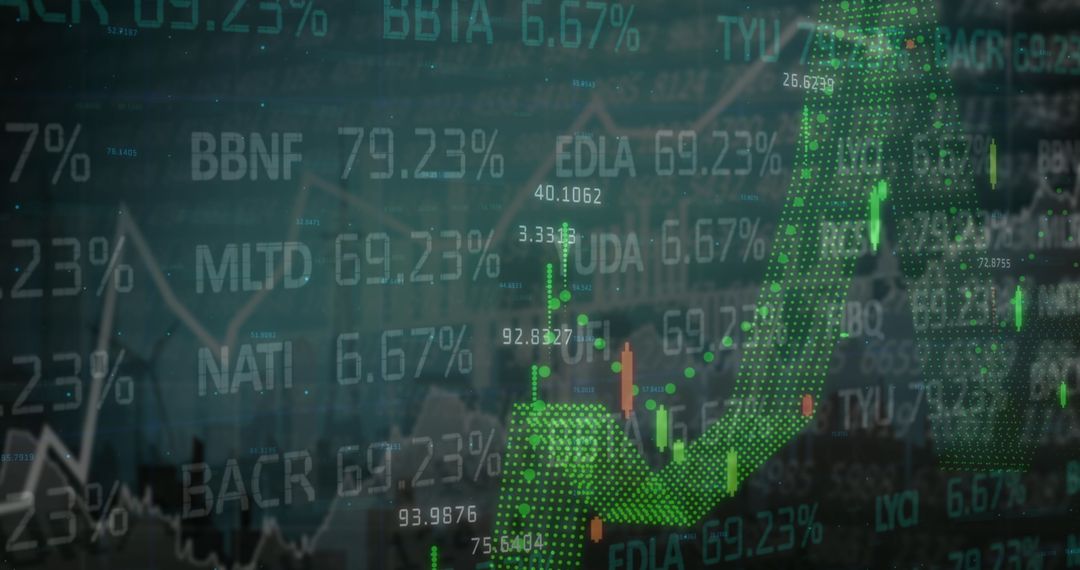
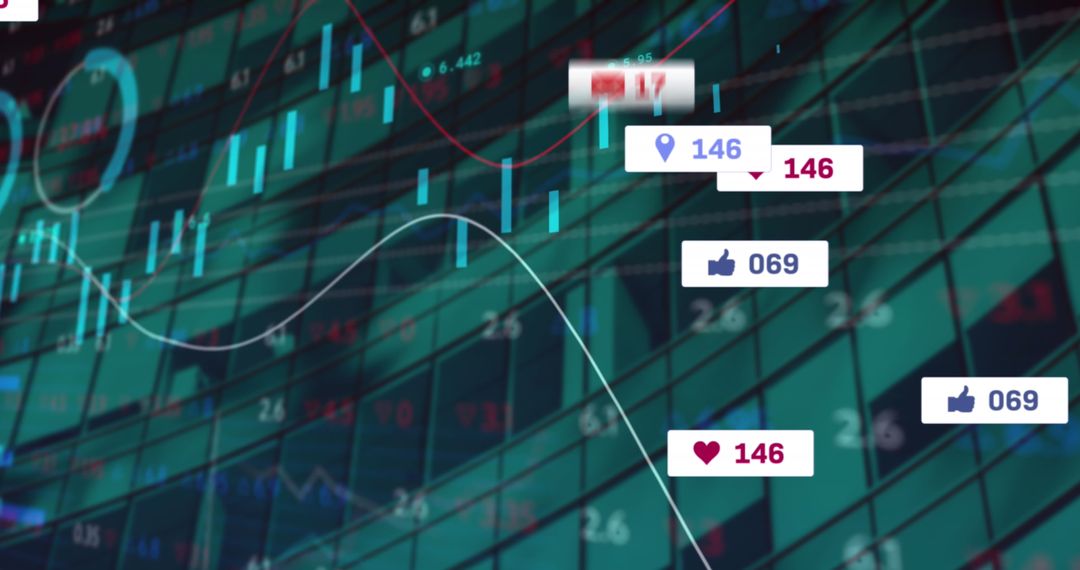
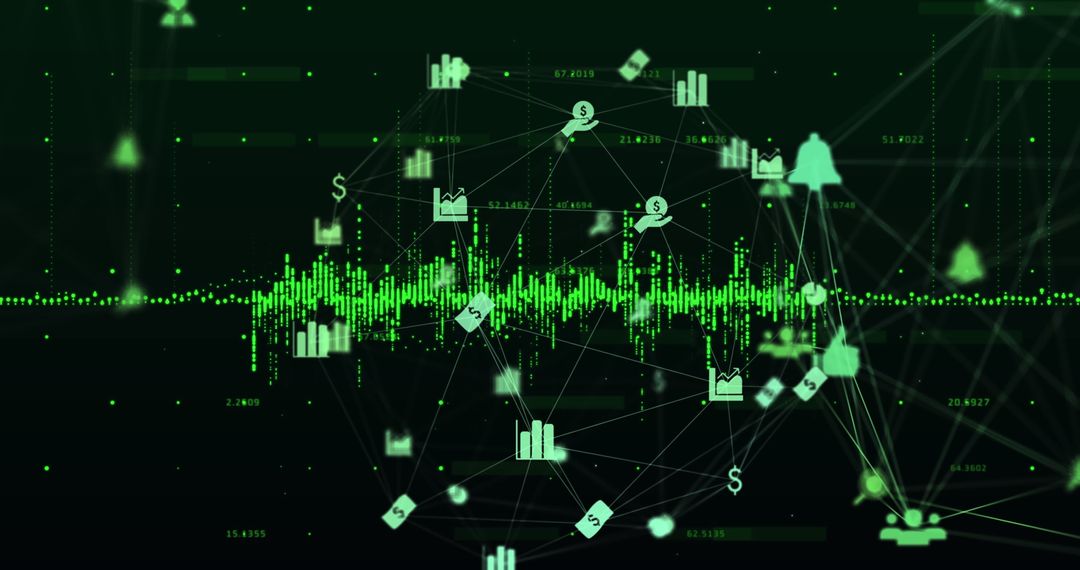
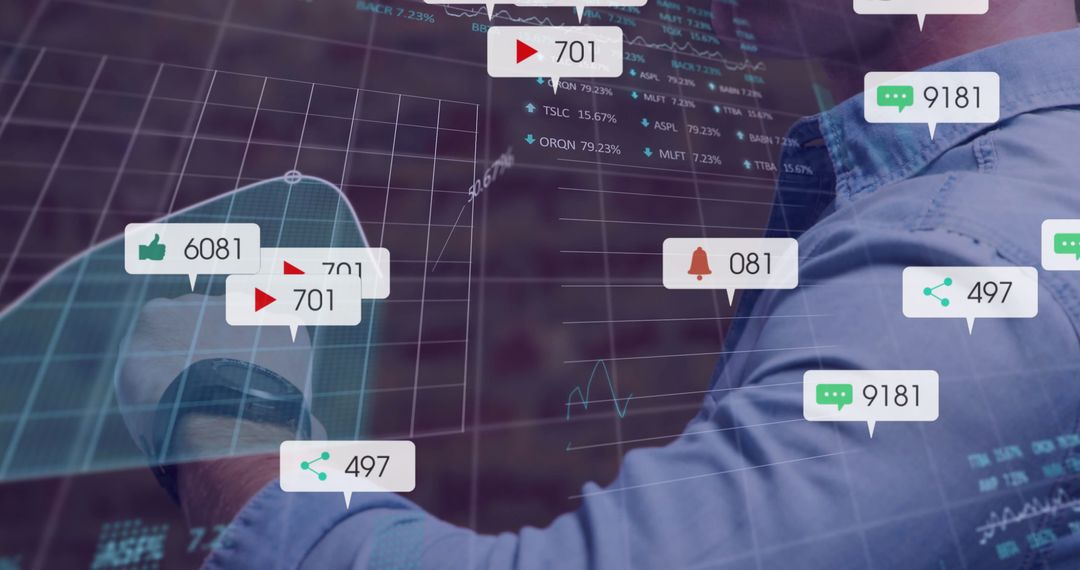
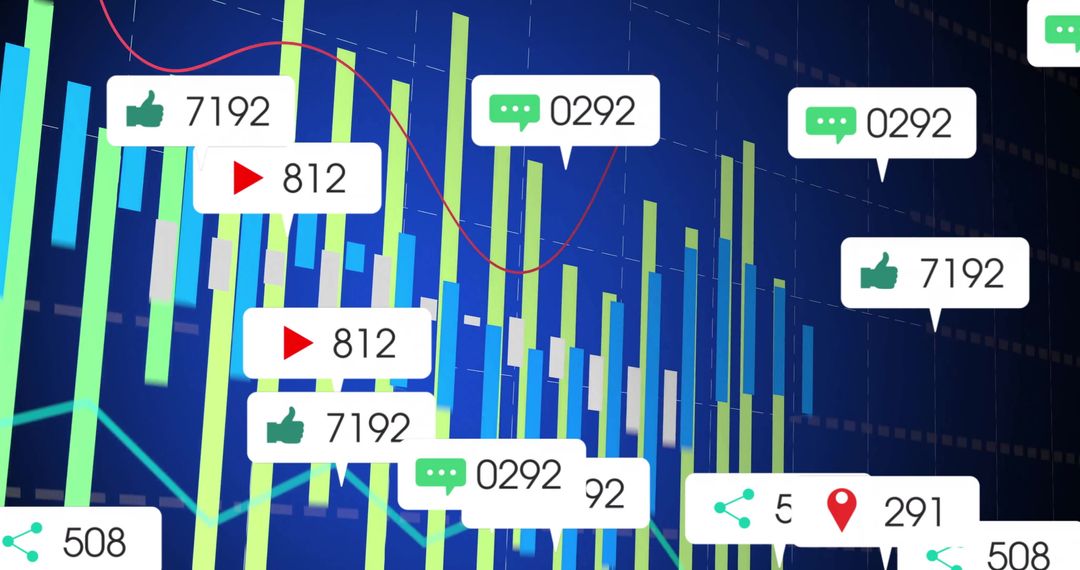
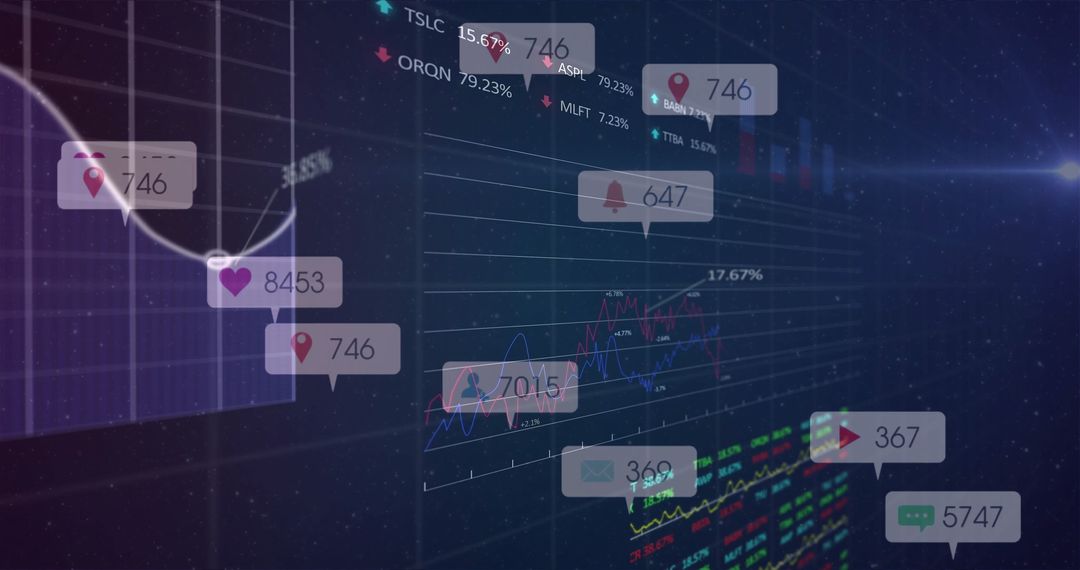
- Financial Trading Dashboard with Rising Chart and Notifications
Financial Trading Dashboard with Rising Chart and Notifications Image
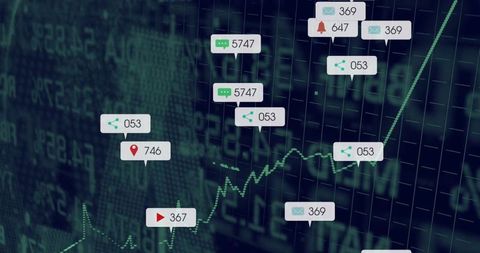
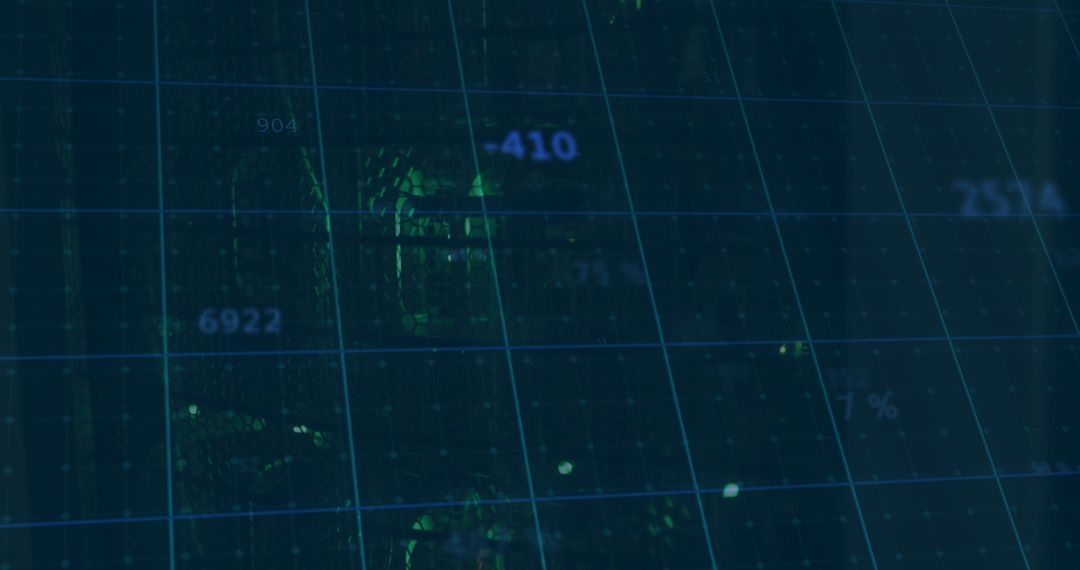
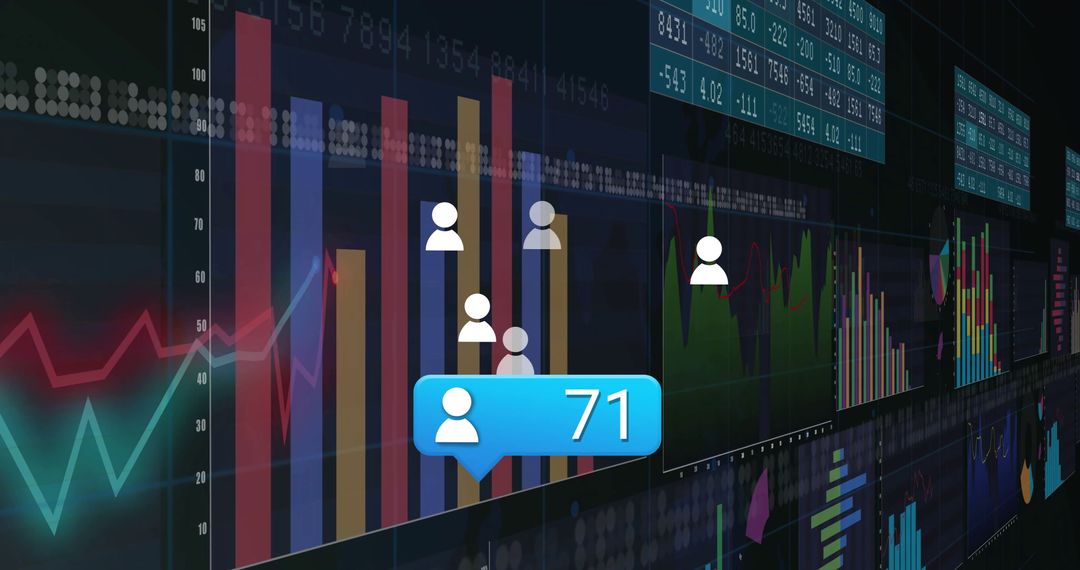
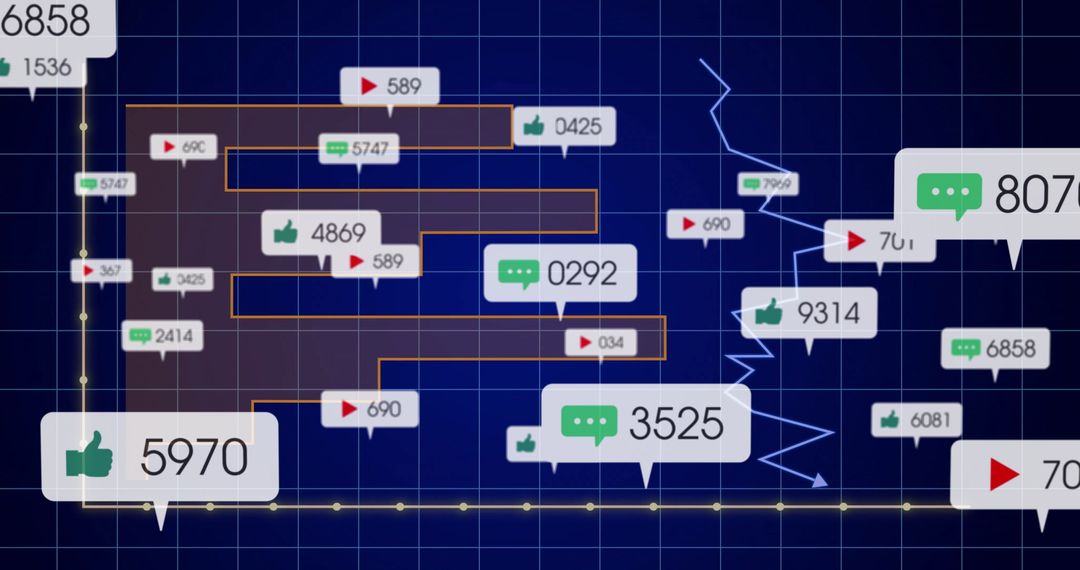
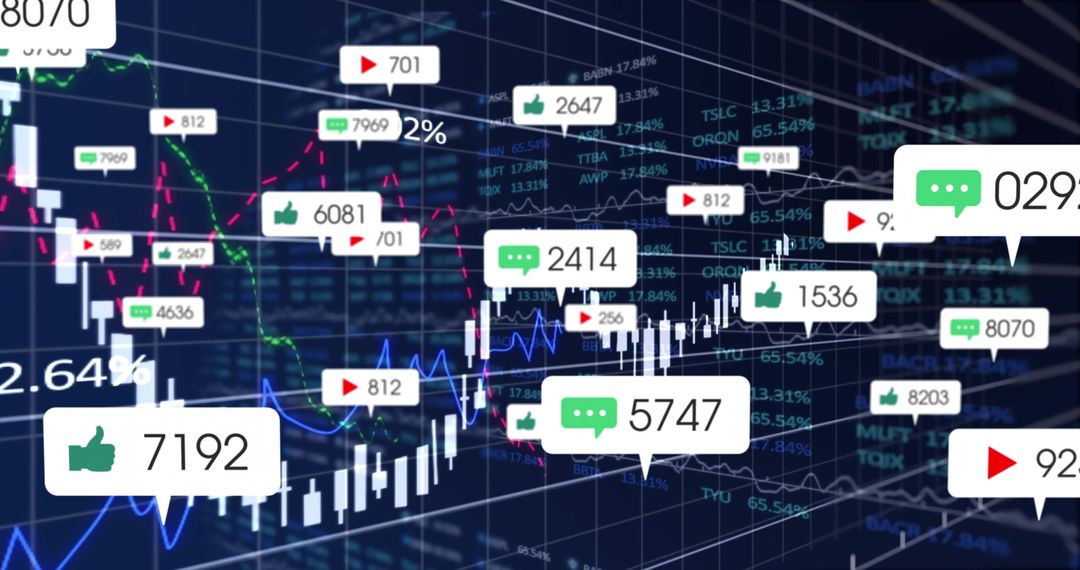
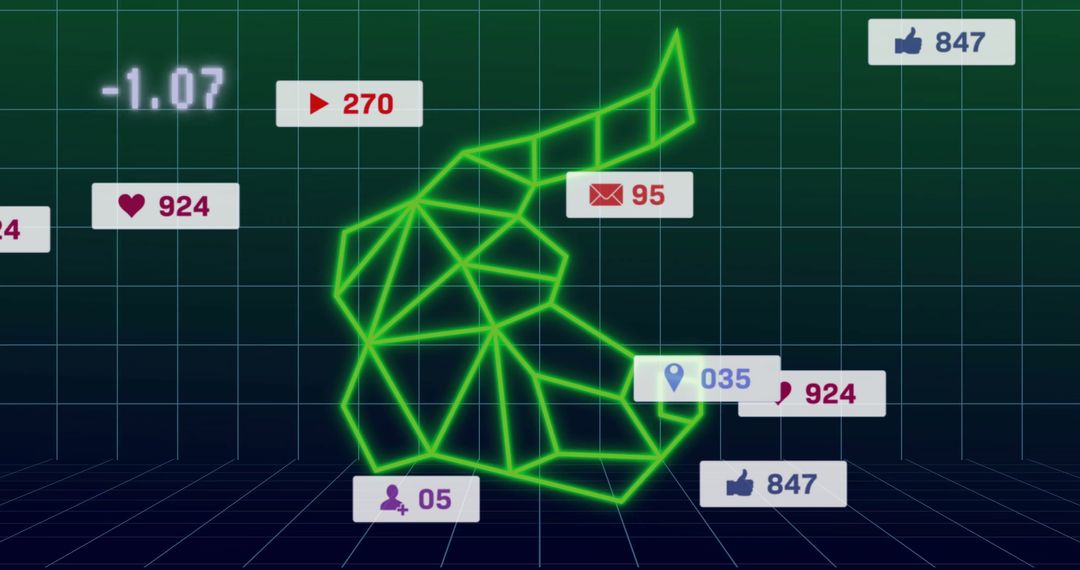
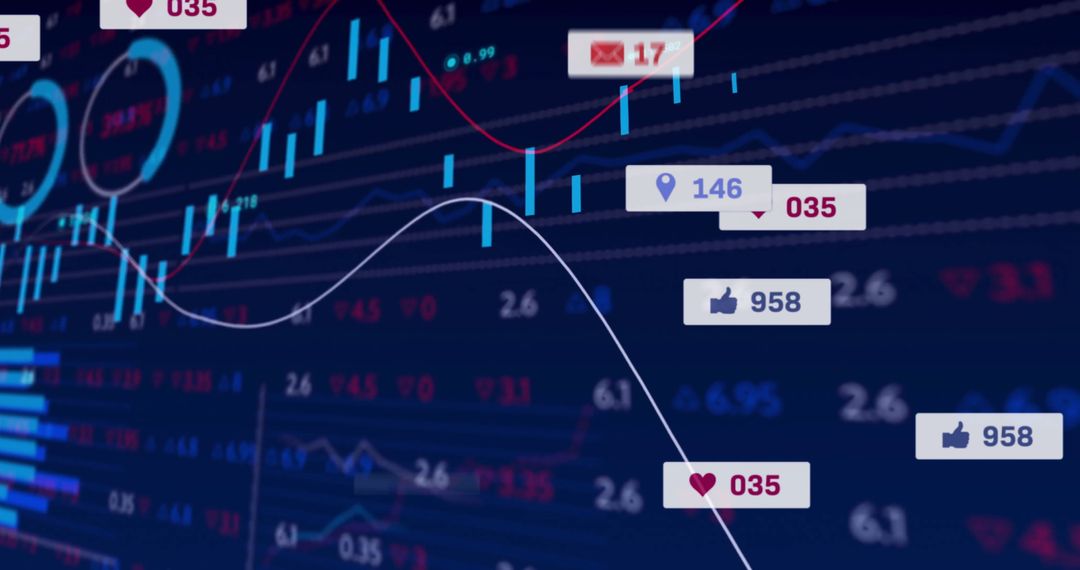
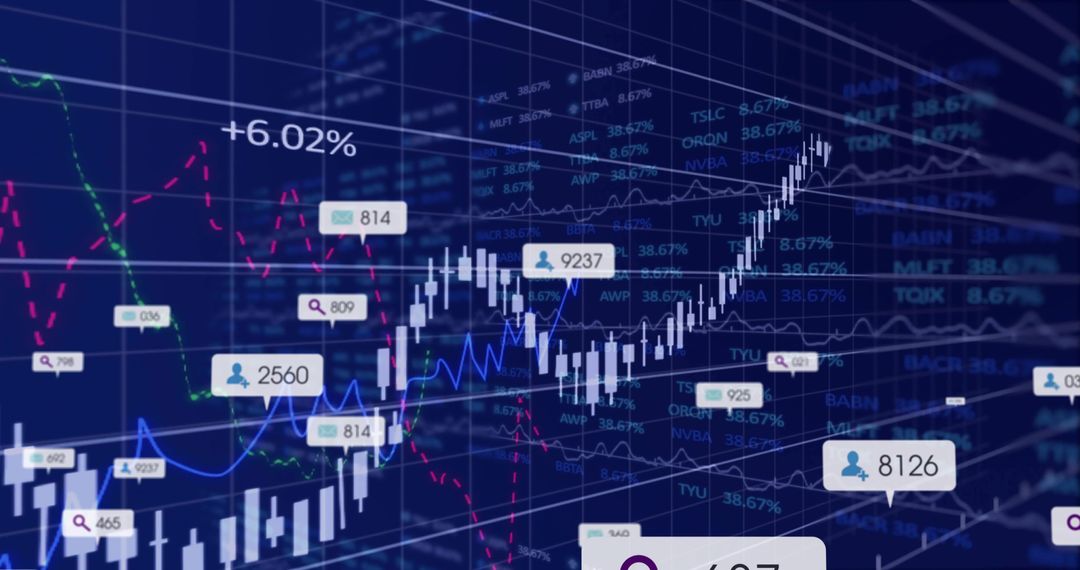
Digital visualization of financial trends highlights growing stock chart and numerous notifications, indicative of active trading on platform. Suitable for illustrating data analytics technology and market trends concept, ideal for financial news, business analysis content, technology advertorials, or webinars focused on digital interfaces and enhancements within economic trading systems.
Powered by  - Get 15% off with code: PIKWIZARD15


0
downloads
downloads
Tags:
More
Credit Photo
If you would like to credit the Photo, here are some ways you can do so
Text Link
photo Link
<span class="text-link">
<span>
<a target="_blank" href=https://pikwizard.com/photo/financial-trading-dashboard-with-rising-chart-and-notifications/0ce3a3b06ee7ffcc8f4f13efcdb3d053/>PikWizard</a>
</span>
</span>
<span class="image-link">
<span
style="margin: 0 0 20px 0; display: inline-block; vertical-align: middle; width: 100%;"
>
<a
target="_blank"
href="https://pikwizard.com/photo/financial-trading-dashboard-with-rising-chart-and-notifications/0ce3a3b06ee7ffcc8f4f13efcdb3d053/"
style="text-decoration: none; font-size: 10px; margin: 0;"
>
<img src="https://pikwizard.com/pw/medium/0ce3a3b06ee7ffcc8f4f13efcdb3d053.jpg" style="margin: 0; width: 100%;" alt="" />
<p style="font-size: 12px; margin: 0;">PikWizard</p>
</a>
</span>
</span>
Free (free of charge)
Free for personal and commercial use.
Author: Creative Art
Similar Free Stock Images
Premium


Premium


Premium


Premium


Premium


Premium


Premium


Premium


Premium


Premium


Premium


Premium


Premium


Premium


Premium


Premium


Premium


Premium


Premium


Premium


Premium


Premium

Premium


Premium