- Home >
- Stock Photos >
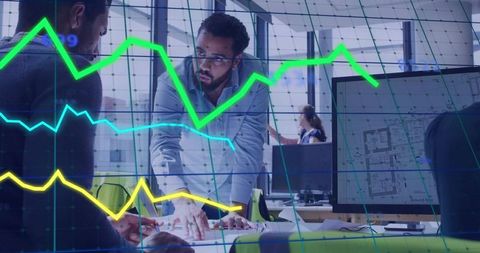
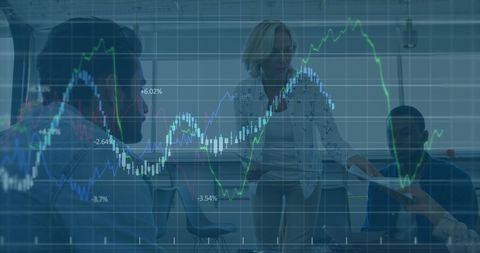
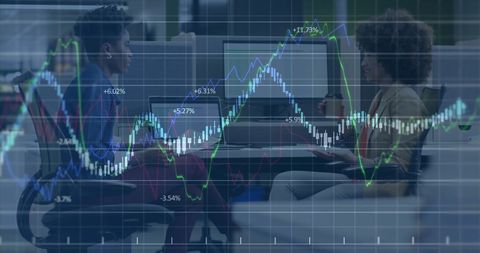
- Financial Trends Overlaid on Office Desks with Data Points
Financial Trends Overlaid on Office Desks with Data Points Image

Digital visualization showing financial data and trends highlighted over office environment with desks and computers, demonstrating analysis and technology in global finance. Useful for illustrating financial concepts, business presentations, and articles discussing economic applications and technology in the finance sector.
Powered by 


2
downloads
downloads
Tags:
More
Credit Photo
If you would like to credit the Photo, here are some ways you can do so
Text Link
photo Link
<span class="text-link">
<span>
<a target="_blank" href=https://pikwizard.com/photo/financial-trends-overlaid-on-office-desks-with-data-points/38721db7dae82269f4649e46a5d166c2/>PikWizard</a>
</span>
</span>
<span class="image-link">
<span
style="margin: 0 0 20px 0; display: inline-block; vertical-align: middle; width: 100%;"
>
<a
target="_blank"
href="https://pikwizard.com/photo/financial-trends-overlaid-on-office-desks-with-data-points/38721db7dae82269f4649e46a5d166c2/"
style="text-decoration: none; font-size: 10px; margin: 0;"
>
<img src="https://pikwizard.com/pw/medium/38721db7dae82269f4649e46a5d166c2.jpg" style="margin: 0; width: 100%;" alt="" />
<p style="font-size: 12px; margin: 0;">PikWizard</p>
</a>
</span>
</span>
Free (free of charge)
Free for personal and commercial use.
Author: People Creations
Similar Free Stock Images

Premium


Premium


Premium


Premium


Premium


Premium


Premium


Premium


Premium


Premium


Premium


Premium


Premium


Premium


Premium


Premium


Premium


Premium


Premium


Premium


Premium


Premium


Premium


Premium


Premium