- Home >
- Stock Photos >
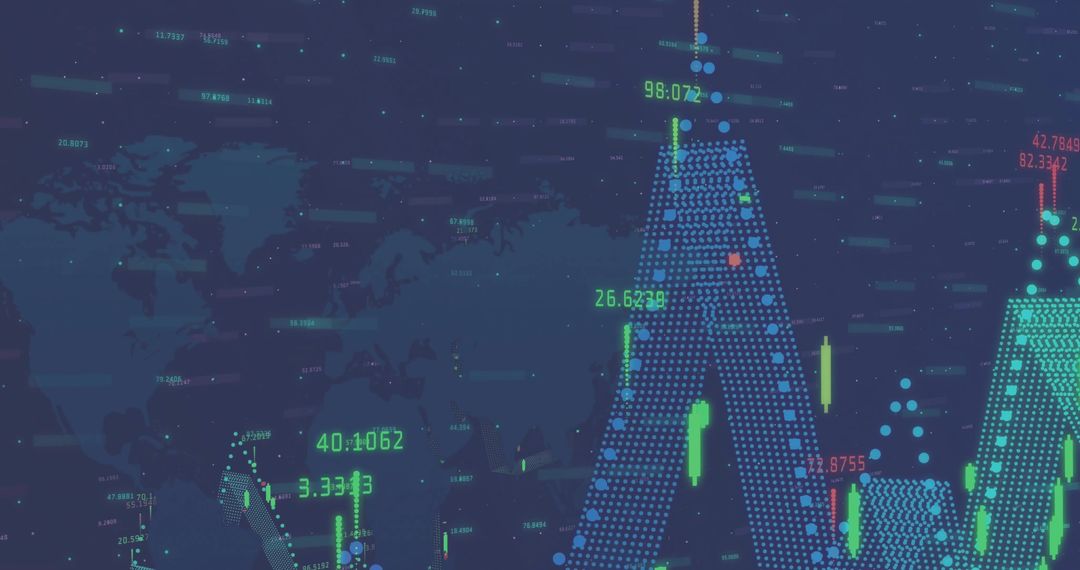
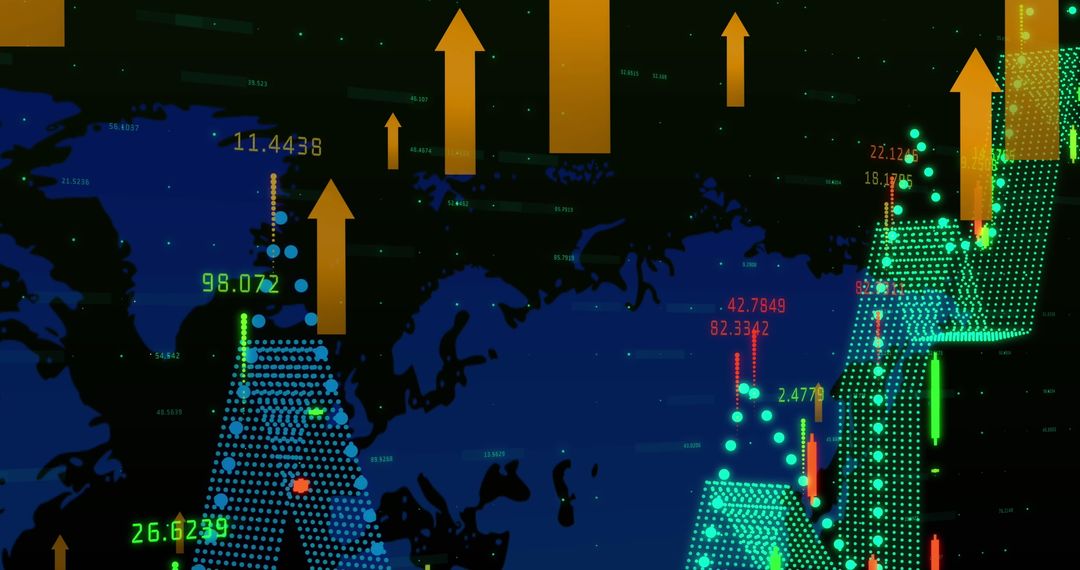
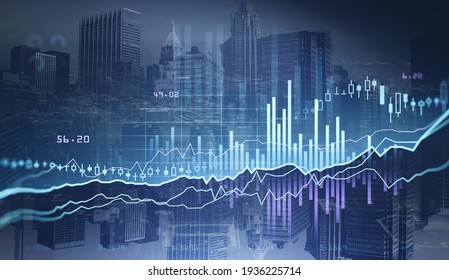
- Floating Business Figures in Digital Finance Display
Floating Business Figures in Digital Finance Display Image

Numbers and data digits hover against an orange gradient backdrop, depicting fluctuation in economic markets and digital financial analysis. Ideal for use in presentations related to financial statistics, business strategies, economic forecasting, data visualization technologies, or the dynamic nature of financial markets.
Powered by  - Get 15% off with code: PIKWIZARD15


2
downloads
downloads
Tags:
More
Credit Photo
If you would like to credit the Photo, here are some ways you can do so
Text Link
photo Link
<span class="text-link">
<span>
<a target="_blank" href=https://pikwizard.com/photo/floating-business-figures-in-digital-finance-display/365a9e800ac169458ccfdbdee7256fc6/>PikWizard</a>
</span>
</span>
<span class="image-link">
<span
style="margin: 0 0 20px 0; display: inline-block; vertical-align: middle; width: 100%;"
>
<a
target="_blank"
href="https://pikwizard.com/photo/floating-business-figures-in-digital-finance-display/365a9e800ac169458ccfdbdee7256fc6/"
style="text-decoration: none; font-size: 10px; margin: 0;"
>
<img src="https://pikwizard.com/pw/medium/365a9e800ac169458ccfdbdee7256fc6.jpg" style="margin: 0; width: 100%;" alt="" />
<p style="font-size: 12px; margin: 0;">PikWizard</p>
</a>
</span>
</span>
Free (free of charge)
Free for personal and commercial use.
Author: People Creations
Similar Free Stock Images
Premium


Premium


Premium


Premium


Premium


Premium


Premium


Premium


Premium


Premium


Premium


Premium


Premium


Premium


Premium


Premium


Premium


Premium


Premium


Premium


Premium


Premium


Premium


Premium