- Home >
- Stock Photos >
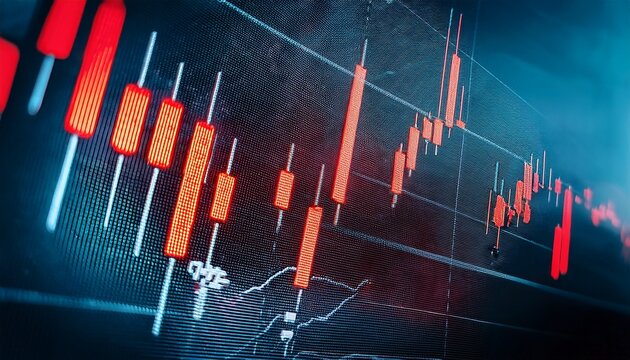
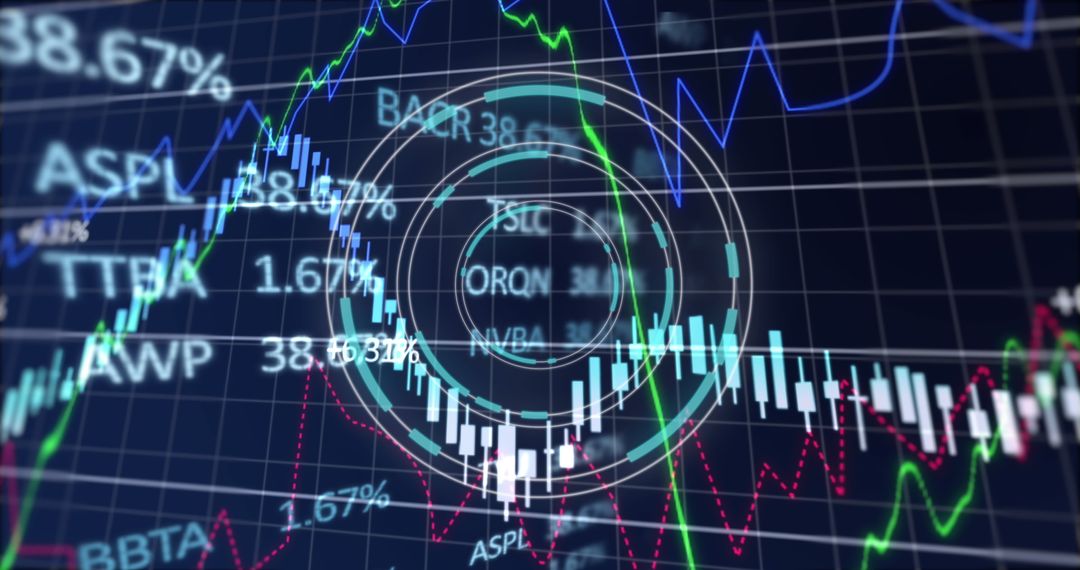
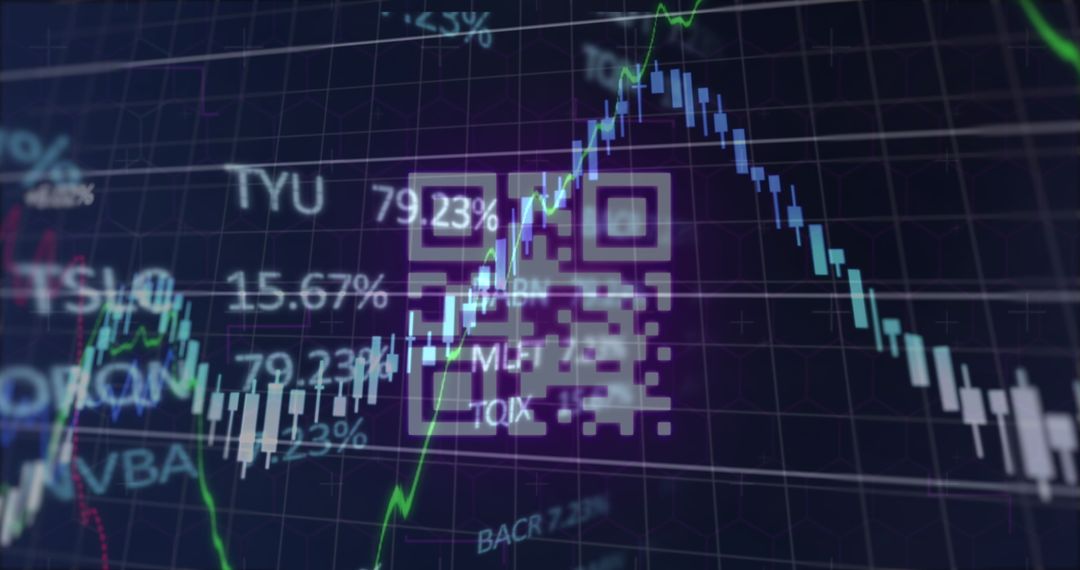
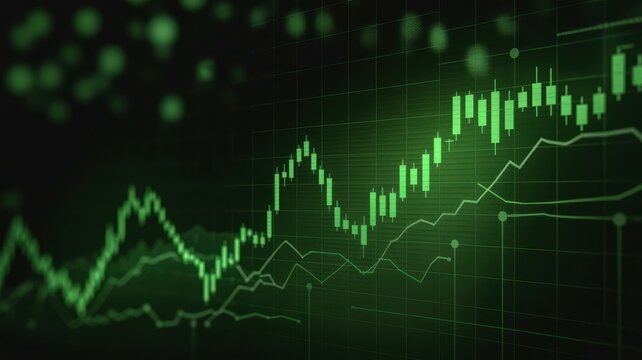
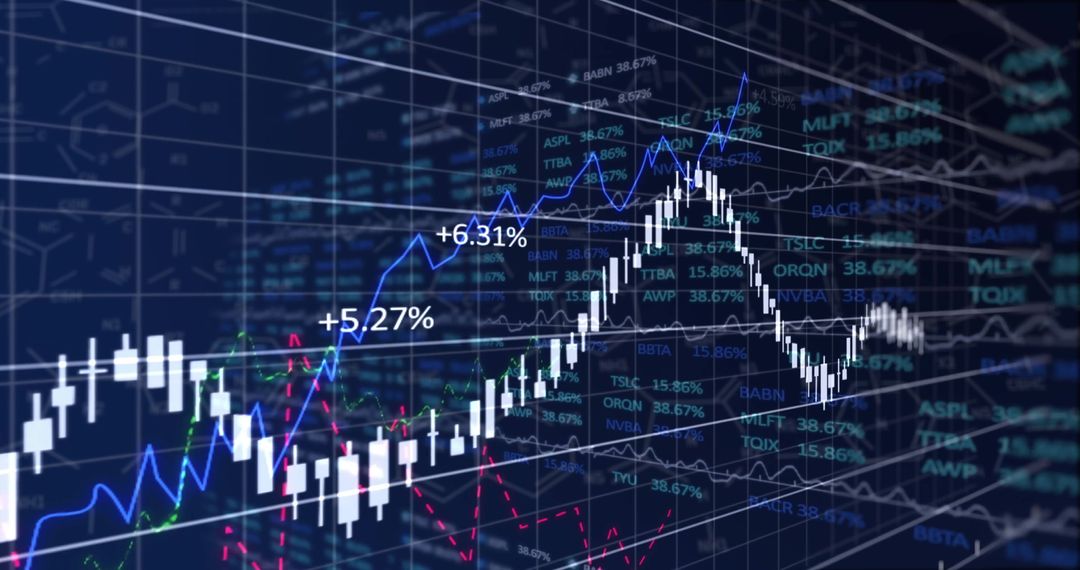
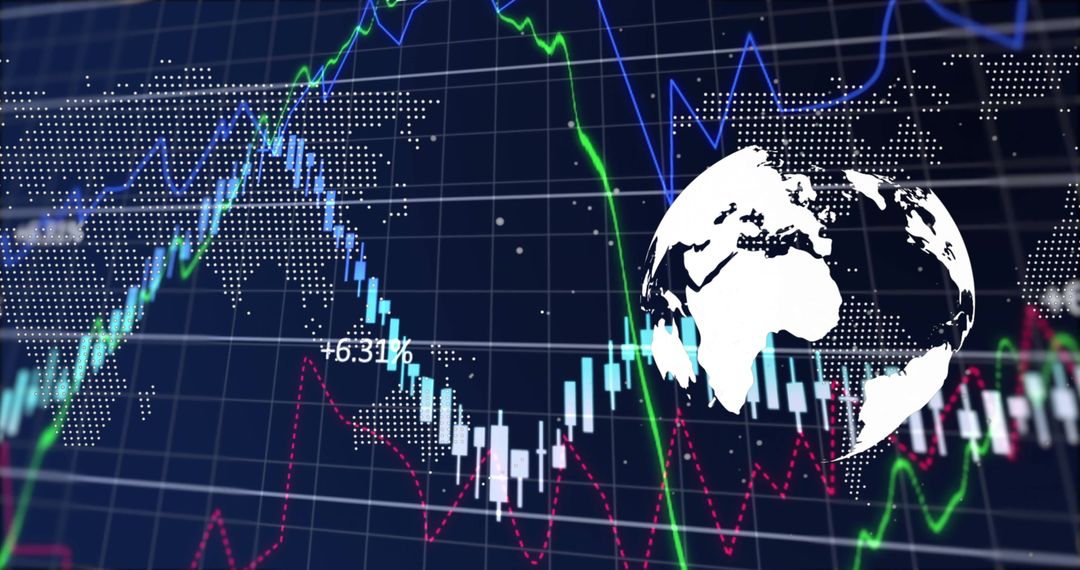
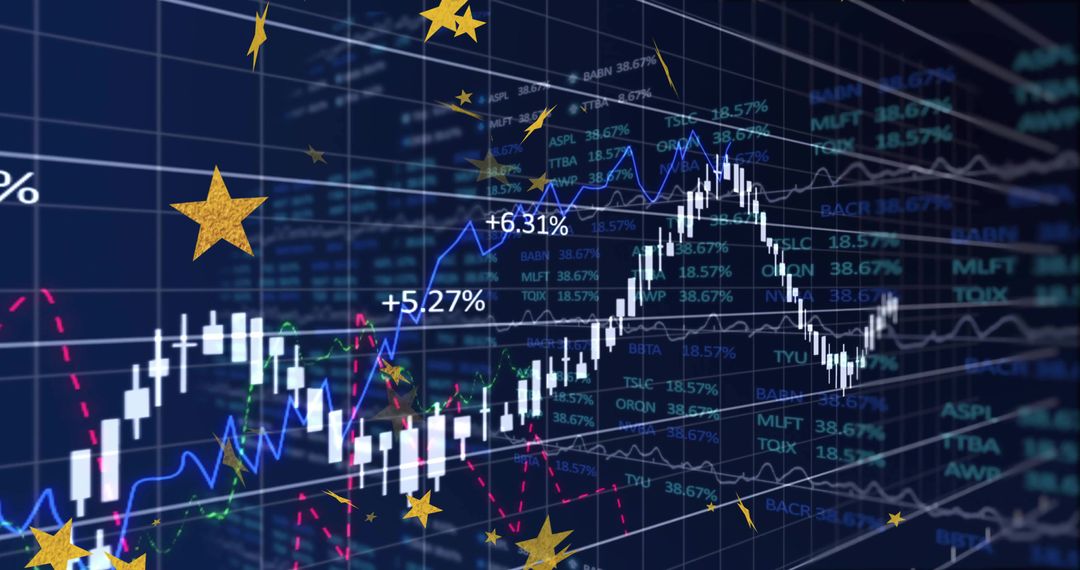
- Fluctuating Financial Stock Chart Display with Candlesticks
Fluctuating Financial Stock Chart Display with Candlesticks Image

High-resolution financial stock chart with fluctuating candlesticks and percentage labels shows vibrant investor dynamics. Overlay of ticker symbols and data metrics optimizes for presentations or seminars on market strategies, stock analysis, and economic forecasts in dynamic business engagements. Visually appealing for web or print marketing in banking or investment fields, emphasizing on technology integration.
Powered by 


0
downloads
downloads
Tags:
More
Credit Photo
If you would like to credit the Photo, here are some ways you can do so
Text Link
photo Link
<span class="text-link">
<span>
<a target="_blank" href=https://pikwizard.com/photo/fluctuating-financial-stock-chart-display-with-candlesticks/98b53624c657ed871a13404f54de4908/>PikWizard</a>
</span>
</span>
<span class="image-link">
<span
style="margin: 0 0 20px 0; display: inline-block; vertical-align: middle; width: 100%;"
>
<a
target="_blank"
href="https://pikwizard.com/photo/fluctuating-financial-stock-chart-display-with-candlesticks/98b53624c657ed871a13404f54de4908/"
style="text-decoration: none; font-size: 10px; margin: 0;"
>
<img src="https://pikwizard.com/pw/medium/98b53624c657ed871a13404f54de4908.jpg" style="margin: 0; width: 100%;" alt="" />
<p style="font-size: 12px; margin: 0;">PikWizard</p>
</a>
</span>
</span>
Free (free of charge)
Free for personal and commercial use.
Author: Creative Art
Similar Free Stock Images

Premium


Premium


Premium


Premium


Premium


Premium


Premium


Premium


Premium


Premium


Premium


Premium


Premium


Premium


Premium


Premium


Premium


Premium


Premium


Premium


Premium


Premium


Premium


Premium