
- Home >
- Stock Photos >
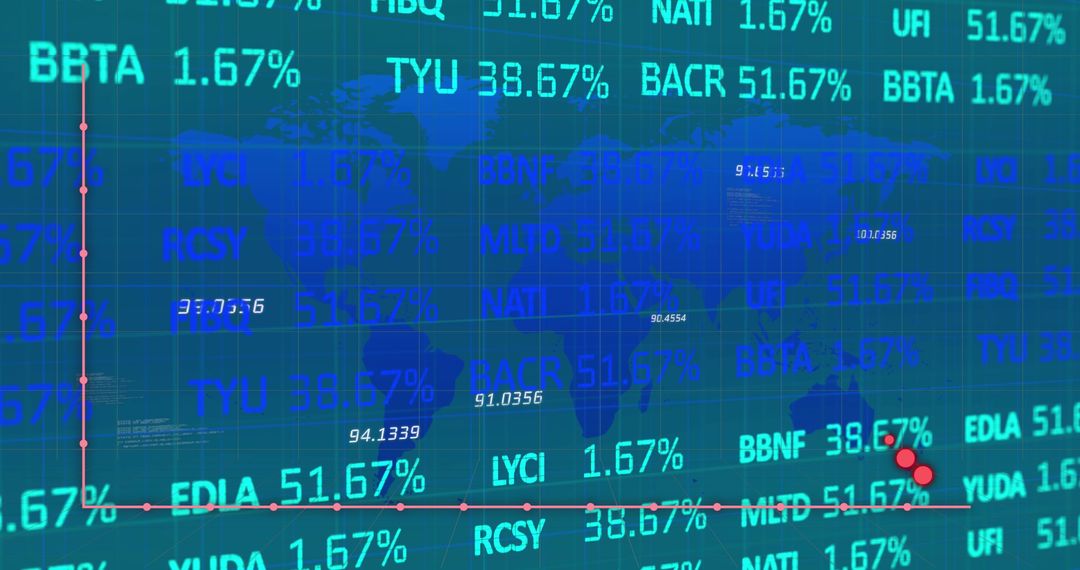
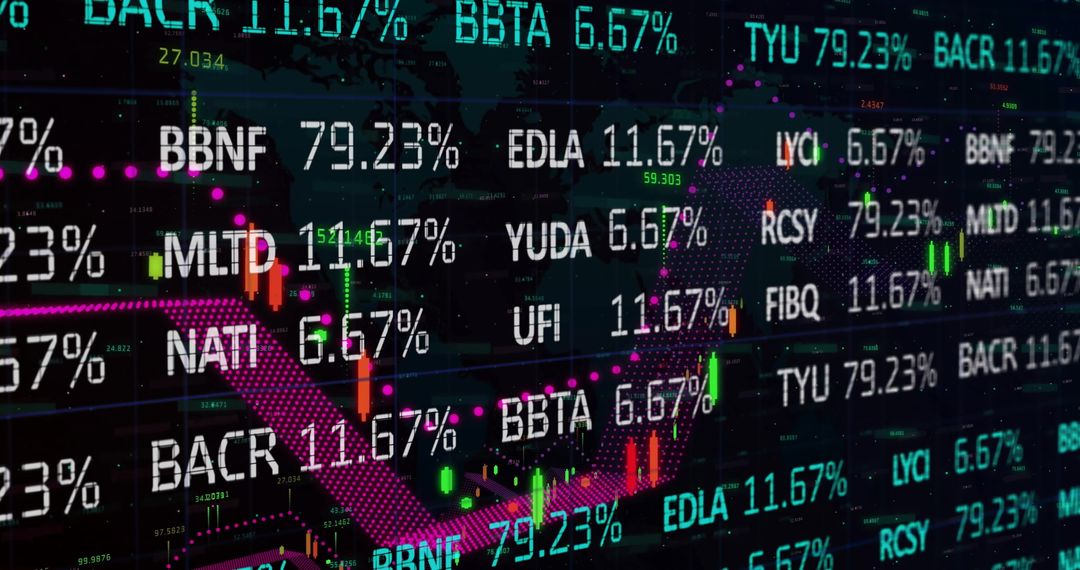
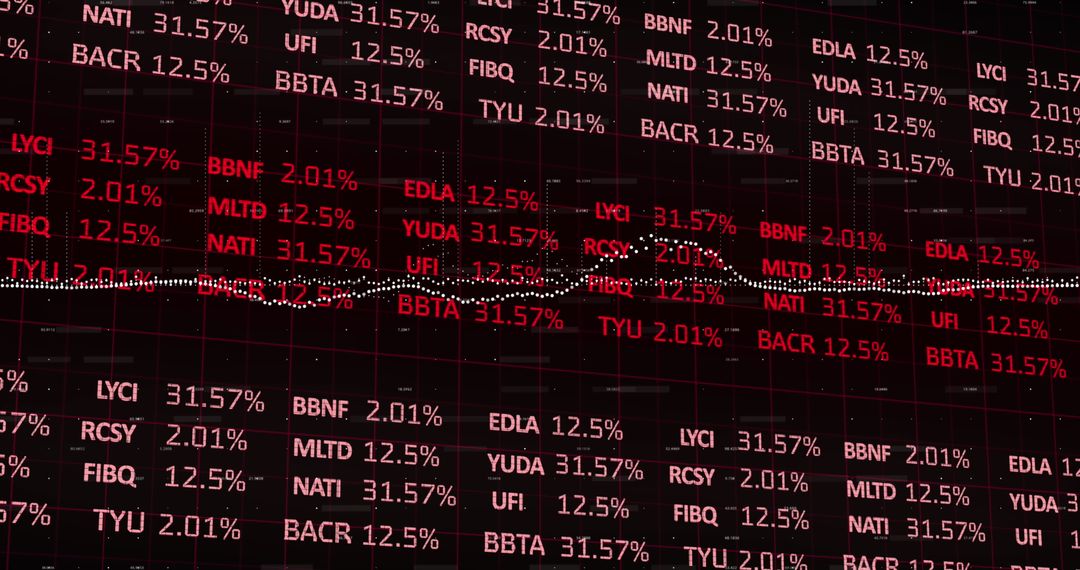
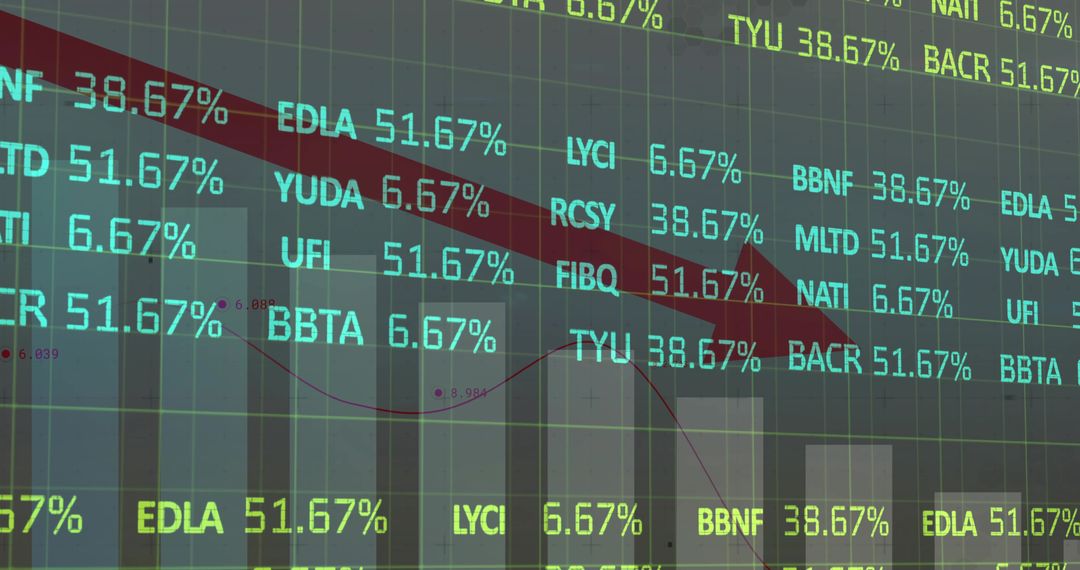
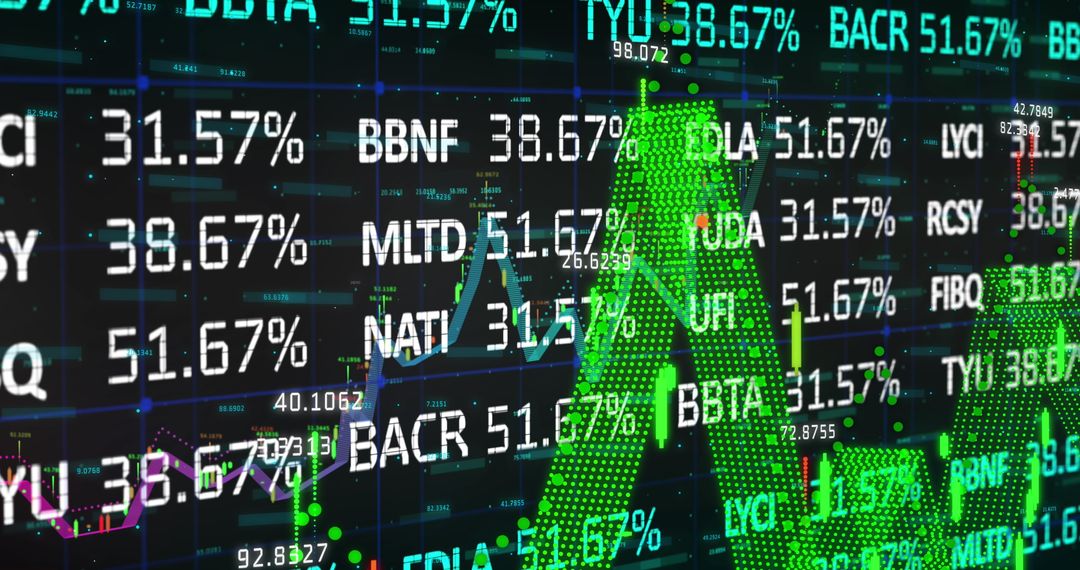
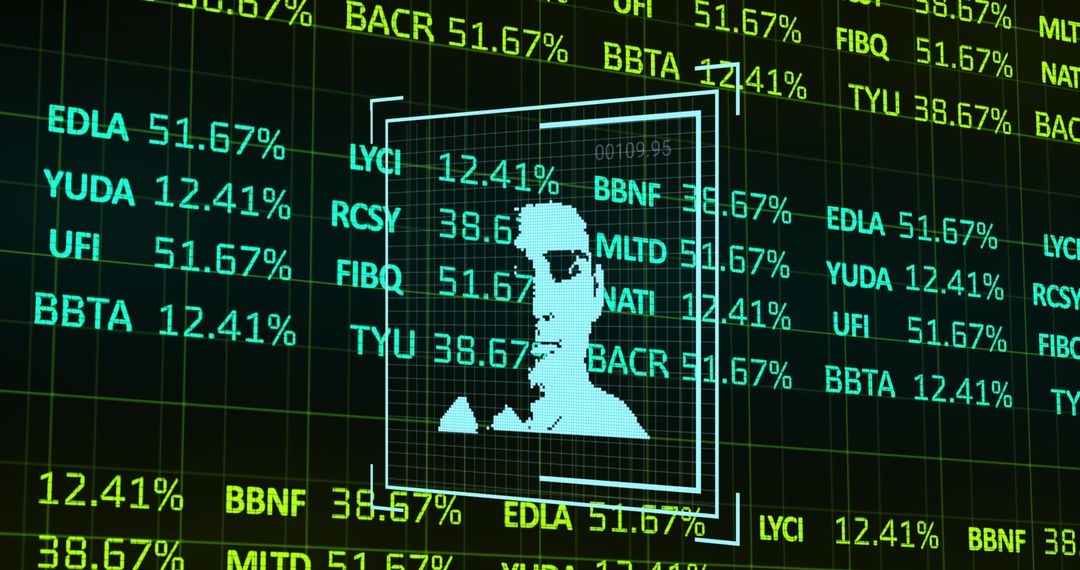
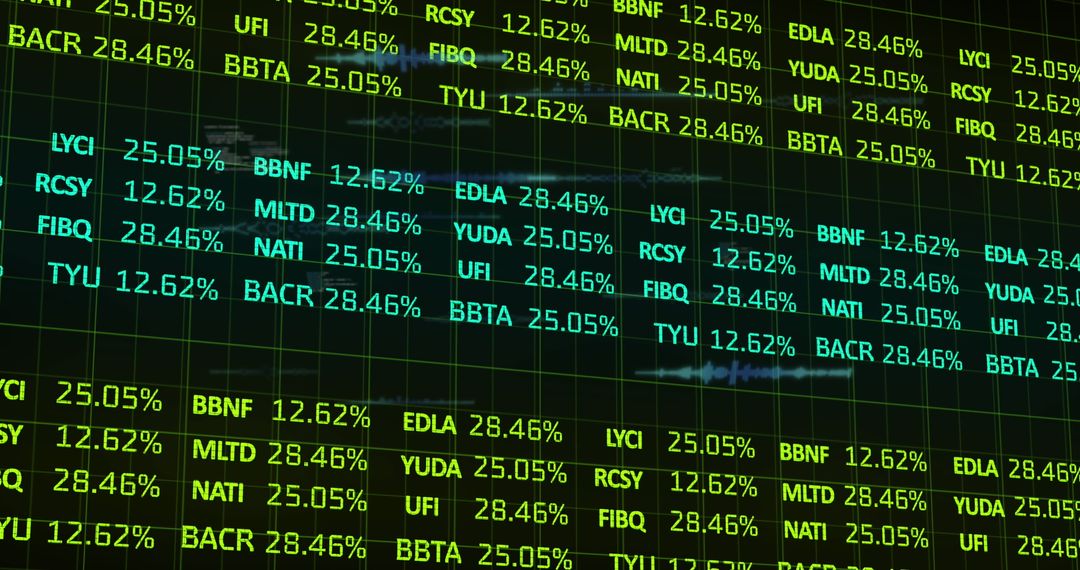
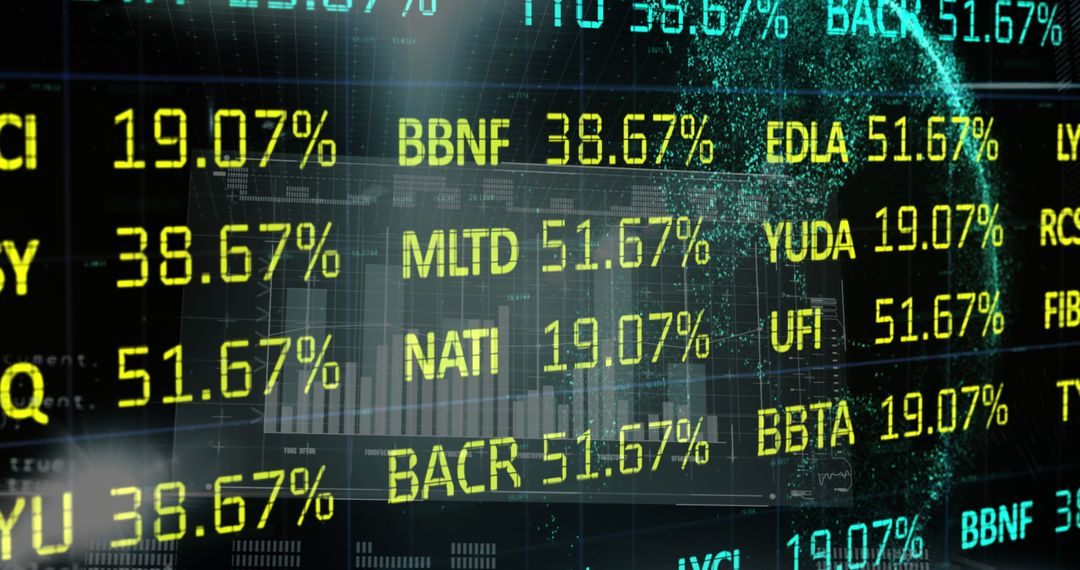
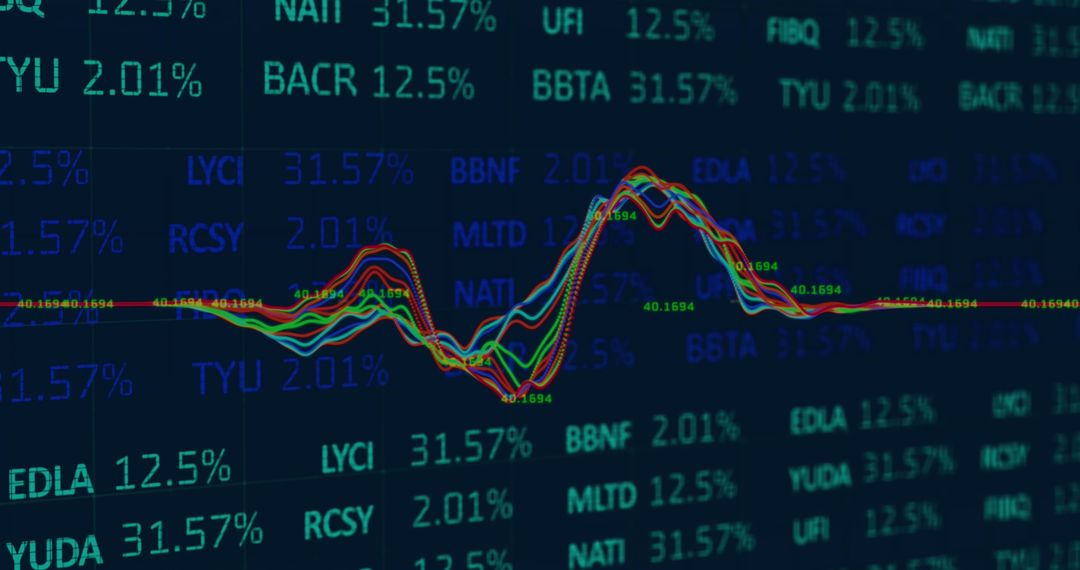
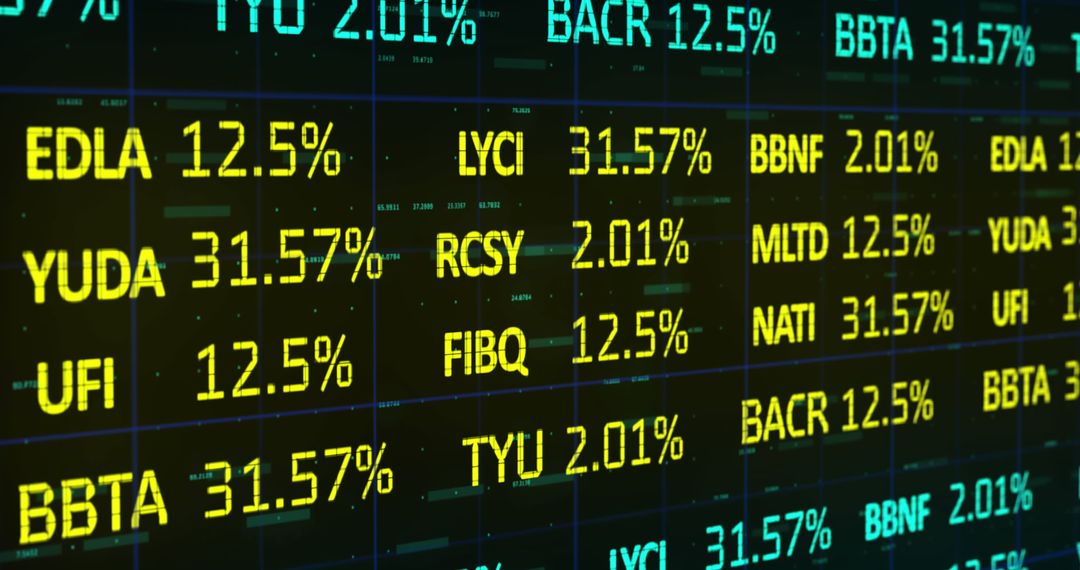
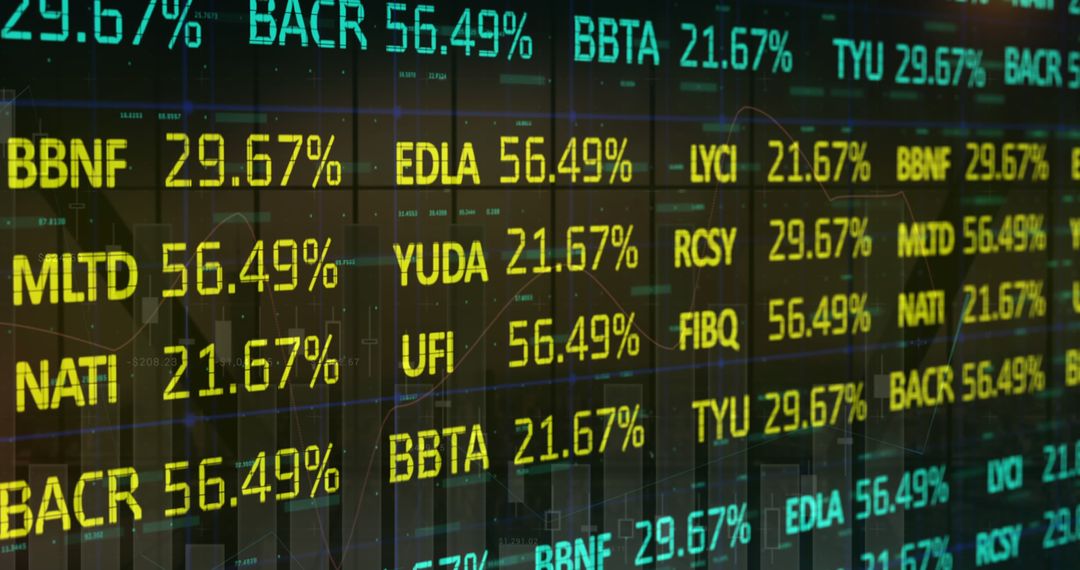
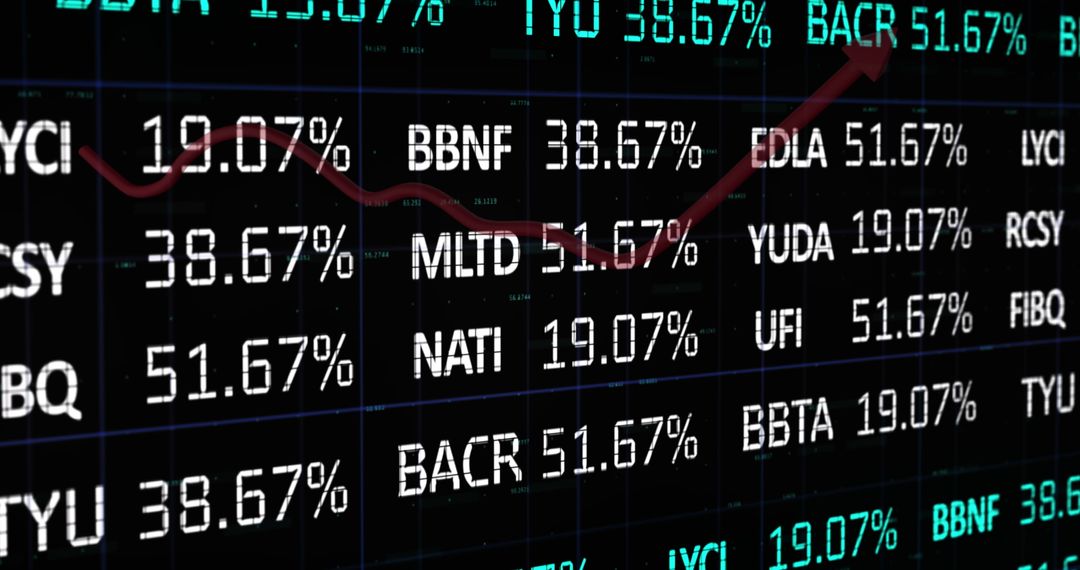
- Fluctuating Stock Market Data and Digital Business Interface
Fluctuating Stock Market Data and Digital Business Interface Image

Display of electronic stocks showing various market values and arrows depicting trends. Uses include illustrating market analyses, finance blogs, business reports, and investment strategies.
Powered by  - Get 15% off with code: PIKWIZARD15


2
downloads
downloads
Tags:
More
Credit Photo
If you would like to credit the Photo, here are some ways you can do so
Text Link
photo Link
<span class="text-link">
<span>
<a target="_blank" href=https://pikwizard.com/photo/fluctuating-stock-market-data-and-digital-business-interface/1dc56a17593a9a3e9dd5f1e02914f172/>PikWizard</a>
</span>
</span>
<span class="image-link">
<span
style="margin: 0 0 20px 0; display: inline-block; vertical-align: middle; width: 100%;"
>
<a
target="_blank"
href="https://pikwizard.com/photo/fluctuating-stock-market-data-and-digital-business-interface/1dc56a17593a9a3e9dd5f1e02914f172/"
style="text-decoration: none; font-size: 10px; margin: 0;"
>
<img src="https://pikwizard.com/pw/medium/1dc56a17593a9a3e9dd5f1e02914f172.jpg" style="margin: 0; width: 100%;" alt="" />
<p style="font-size: 12px; margin: 0;">PikWizard</p>
</a>
</span>
</span>
Free (free of charge)
Free for personal and commercial use.
Author: People Creations
Similar Free Stock Images

Premium


Premium


Premium


Premium


Premium


Premium


Premium


Premium


Premium


Premium


Premium


Premium


Premium


Premium


Premium


Premium


Premium


Premium


Premium


Premium


Premium


Premium


Premium


Premium

