
- Home >
- Stock Photos >
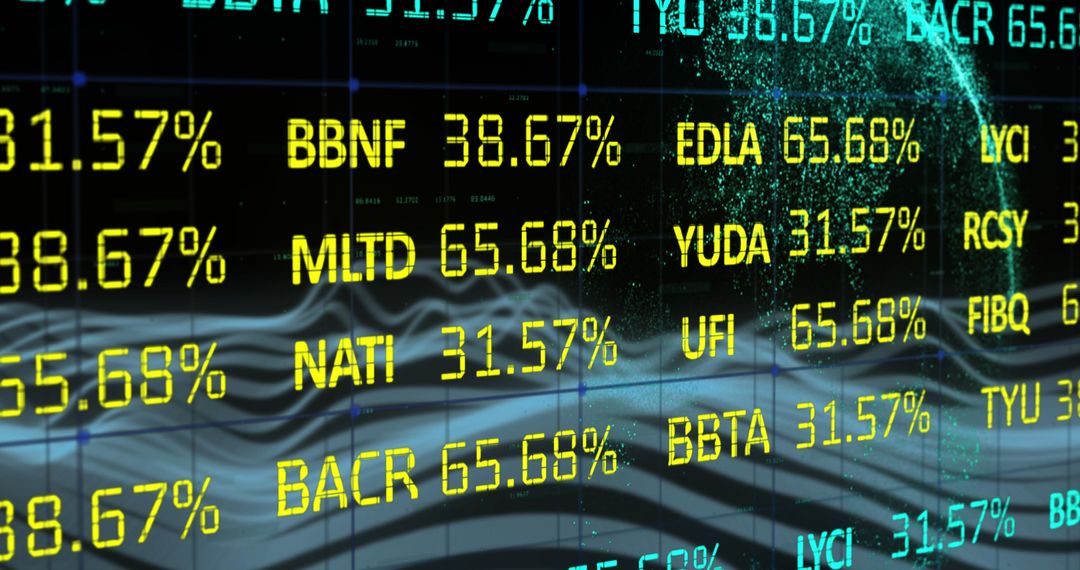
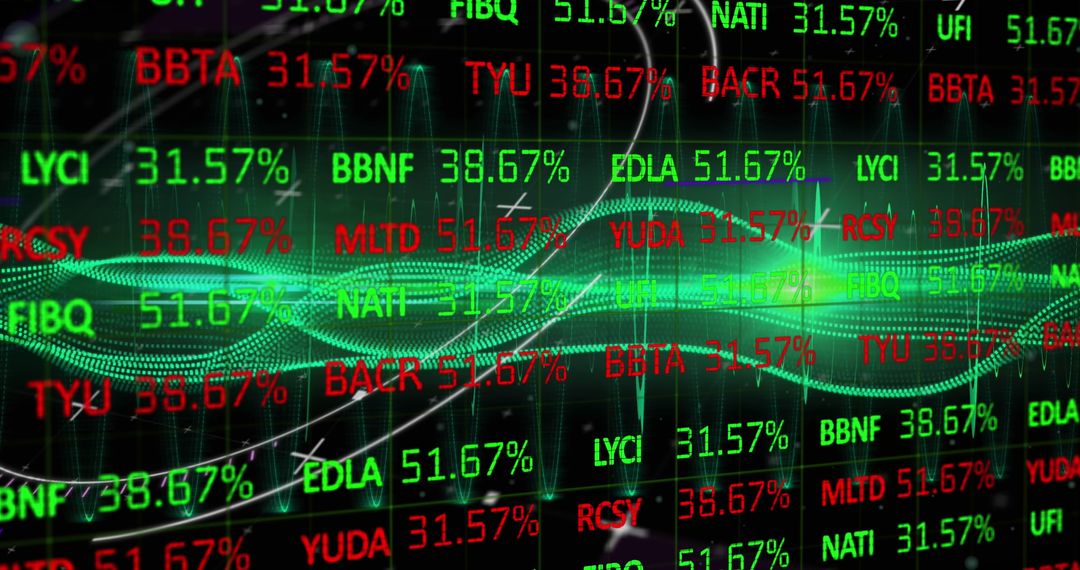
- Fluctuating Stock Market Display with Financial Data and Analytics
Fluctuating Stock Market Display with Financial Data and Analytics Image

Vibrant display features constantly changing numbers representing stock prices and financial indices. This visualization of the stock market is ideal for use in content related to finance, trading, investment strategy, or economic analysis, offering insights into market fluctuations and financial health.
Powered by  - Get 15% off with code: PIKWIZARD15


2
downloads
downloads
Tags:
More
Credit Photo
If you would like to credit the Photo, here are some ways you can do so
Text Link
photo Link
<span class="text-link">
<span>
<a target="_blank" href=https://pikwizard.com/photo/fluctuating-stock-market-display-with-financial-data-and-analytics/f6f83badc3833ea3b92782c4bb98bc4e/>PikWizard</a>
</span>
</span>
<span class="image-link">
<span
style="margin: 0 0 20px 0; display: inline-block; vertical-align: middle; width: 100%;"
>
<a
target="_blank"
href="https://pikwizard.com/photo/fluctuating-stock-market-display-with-financial-data-and-analytics/f6f83badc3833ea3b92782c4bb98bc4e/"
style="text-decoration: none; font-size: 10px; margin: 0;"
>
<img src="https://pikwizard.com/pw/medium/f6f83badc3833ea3b92782c4bb98bc4e.jpg" style="margin: 0; width: 100%;" alt="" />
<p style="font-size: 12px; margin: 0;">PikWizard</p>
</a>
</span>
</span>
Free (free of charge)
Free for personal and commercial use.
Author: People Creations
Similar Free Stock Images
Premium


Premium


Premium


Premium


Premium


Premium


Premium


Premium


Premium


Premium


Premium


Premium


Premium


Premium


Premium


Premium


Premium


Premium


Premium


Premium


Premium


Premium


Premium


Premium

