- Home >
- Stock Photos >
- Fuel Gauge Overlaying Rising Data Graphs on Transparently
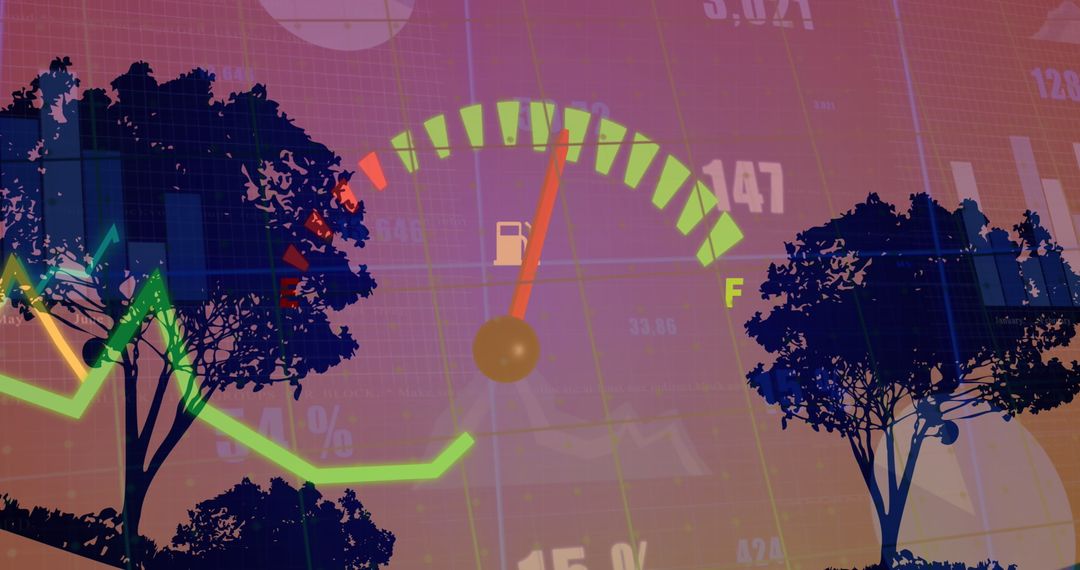
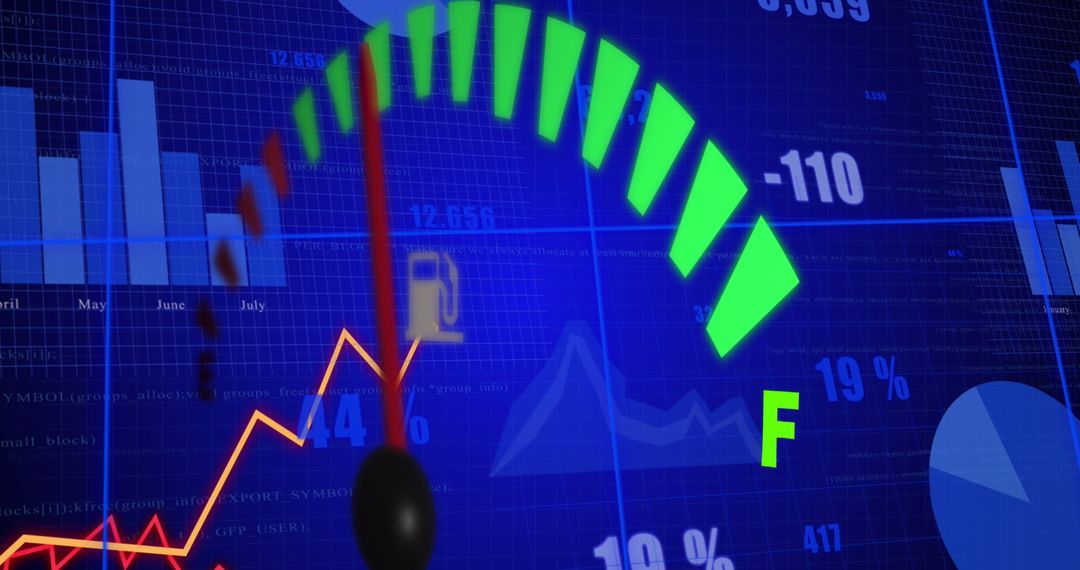
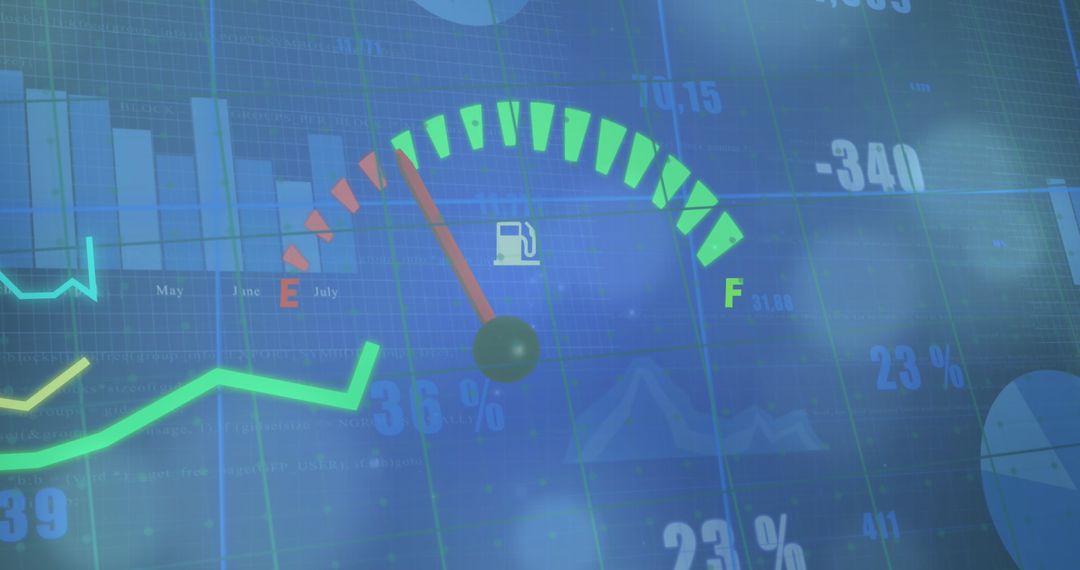
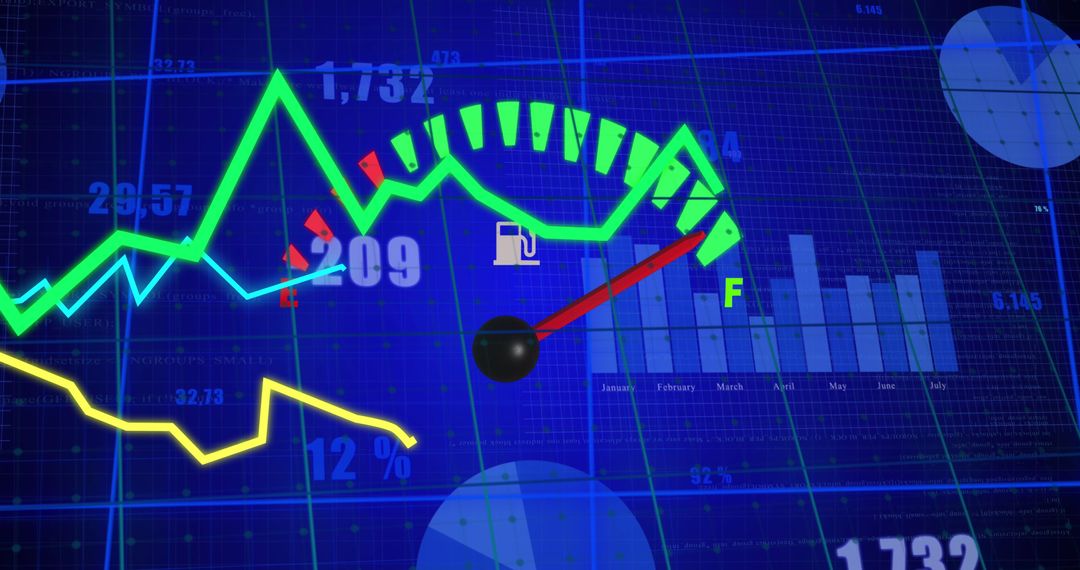
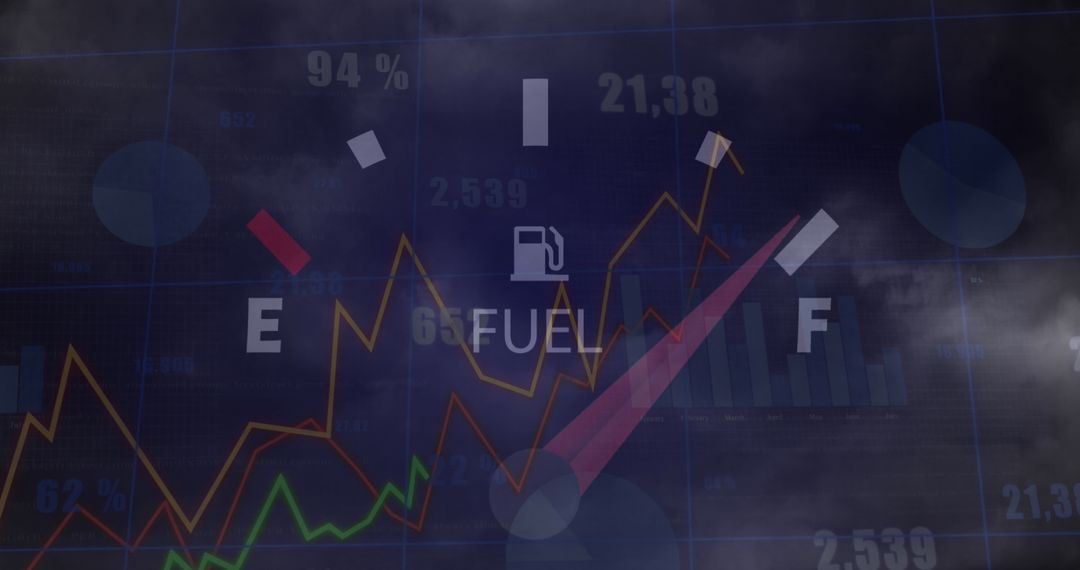
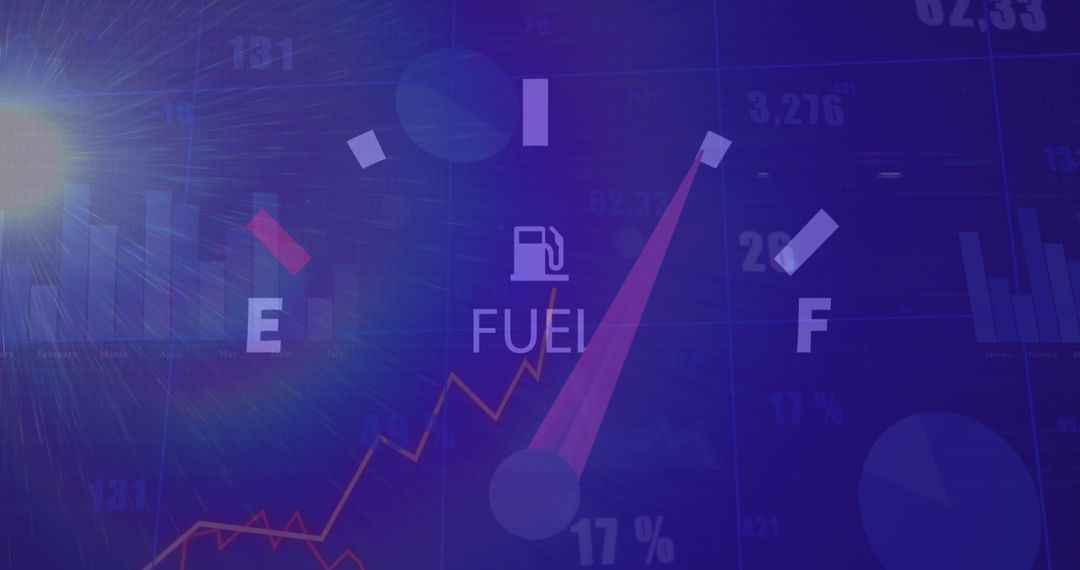
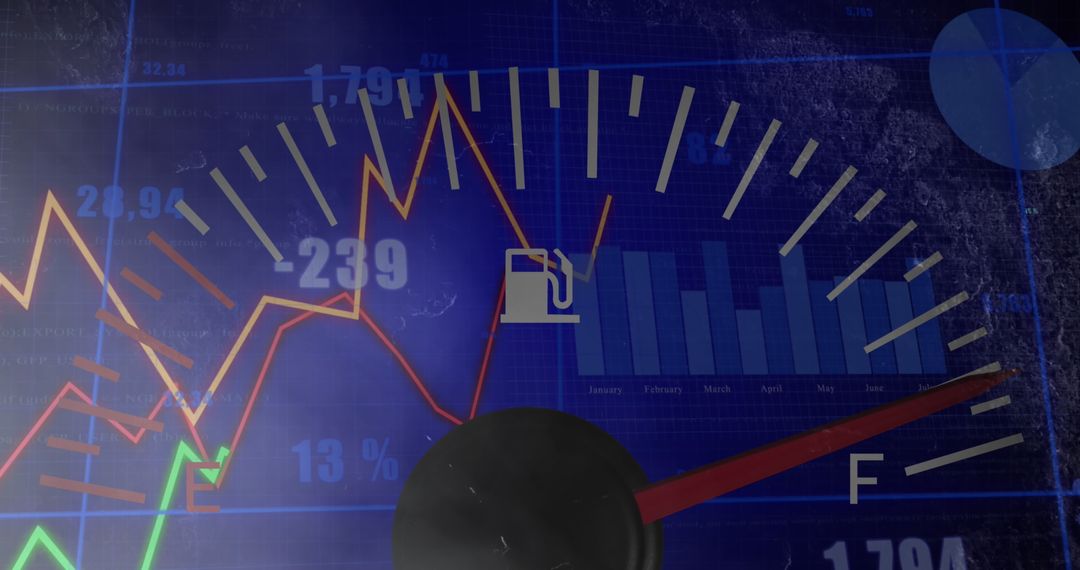
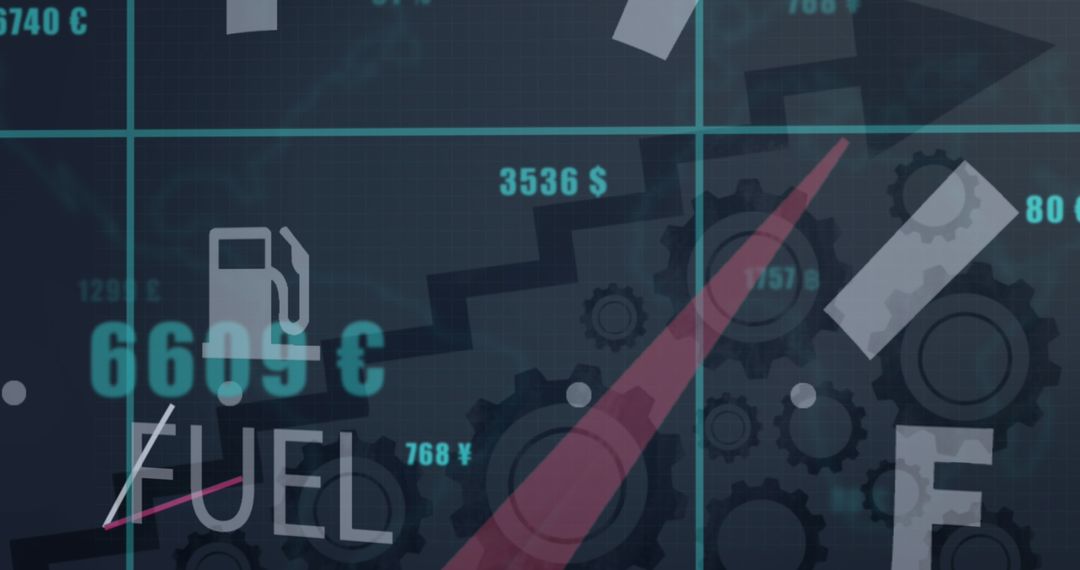
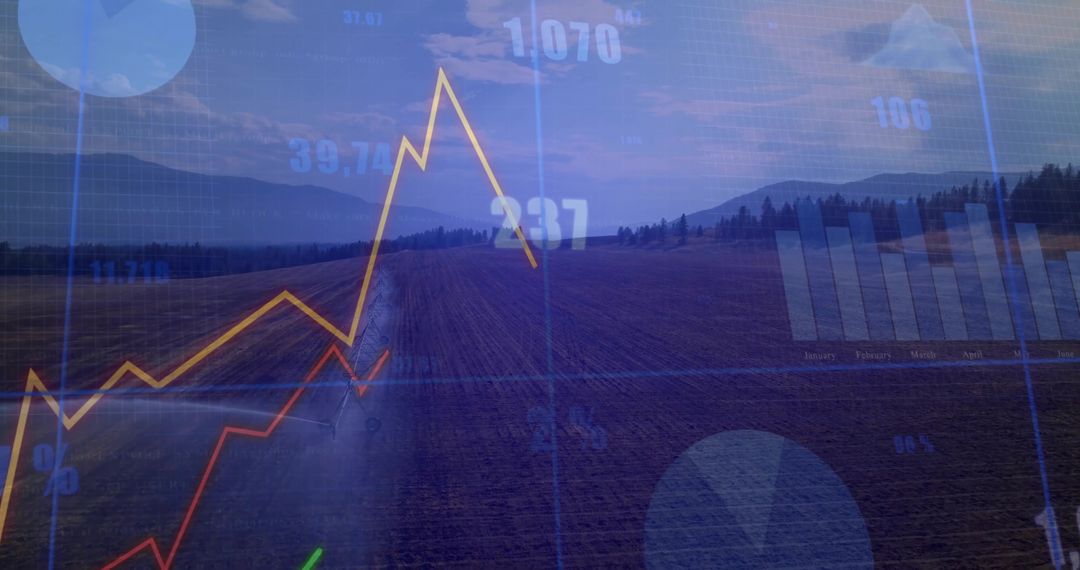
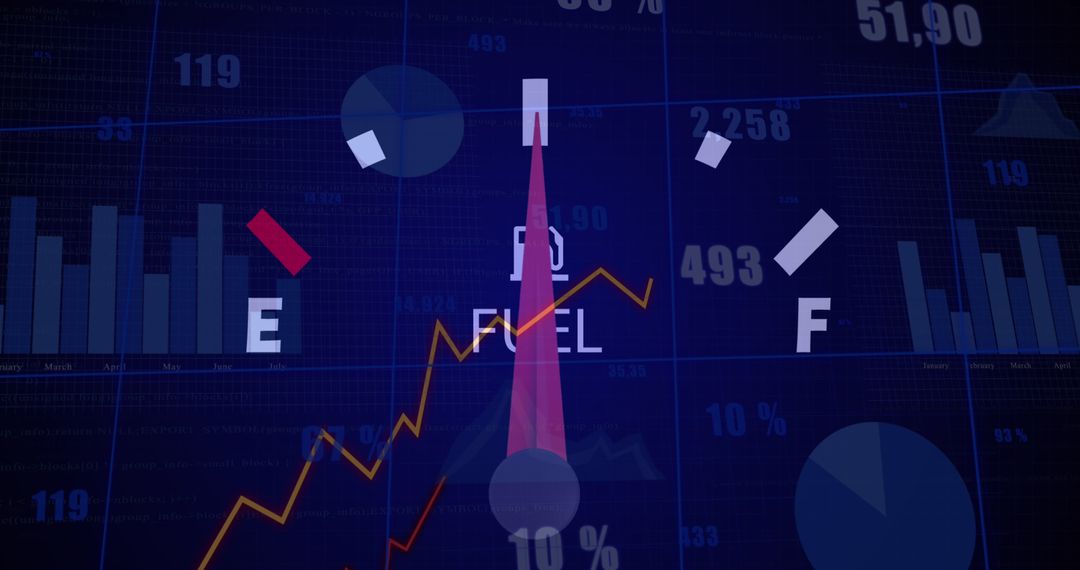
Fuel Gauge Overlaying Rising Data Graphs on Transparently Image
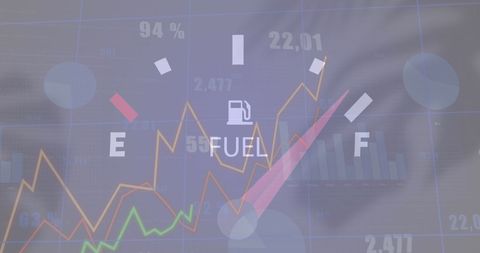
Illustrating concept of data processing and computing with fuel gauge and rising econometric graphs. Useful for car industry presentations, business analytics, and technology visualizations, symbolizing importance of fuel efficiency and economic growth in the automotive sector.
Powered by  - Get 15% off with code: PIKWIZARD15


2
downloads
downloads
Tags:
More
Credit Photo
If you would like to credit the Photo, here are some ways you can do so
Text Link
photo Link
<span class="text-link">
<span>
<a target="_blank" href=https://pikwizard.com/photo/fuel-gauge-overlaying-rising-data-graphs-on-transparently/ec3a141d164fed7d6f8e51ce2954f143/>PikWizard</a>
</span>
</span>
<span class="image-link">
<span
style="margin: 0 0 20px 0; display: inline-block; vertical-align: middle; width: 100%;"
>
<a
target="_blank"
href="https://pikwizard.com/photo/fuel-gauge-overlaying-rising-data-graphs-on-transparently/ec3a141d164fed7d6f8e51ce2954f143/"
style="text-decoration: none; font-size: 10px; margin: 0;"
>
<img src="https://pikwizard.com/pw/medium/ec3a141d164fed7d6f8e51ce2954f143.jpg" style="margin: 0; width: 100%;" alt="" />
<p style="font-size: 12px; margin: 0;">PikWizard</p>
</a>
</span>
</span>
Free (free of charge)
Free for personal and commercial use.
Author: Authentic Images
Similar Free Stock Images