- Home >
- Stock Photos >
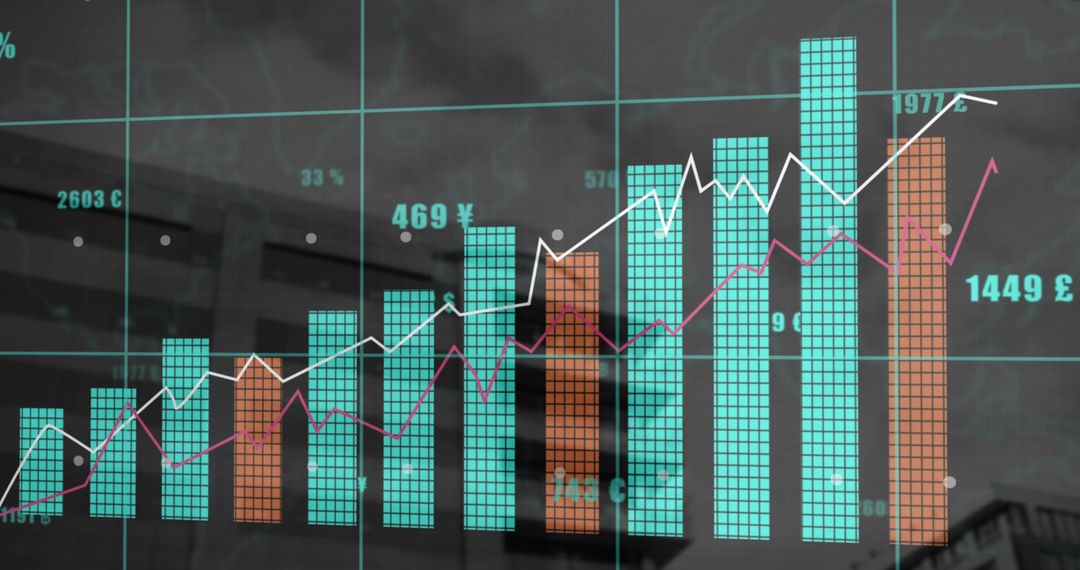
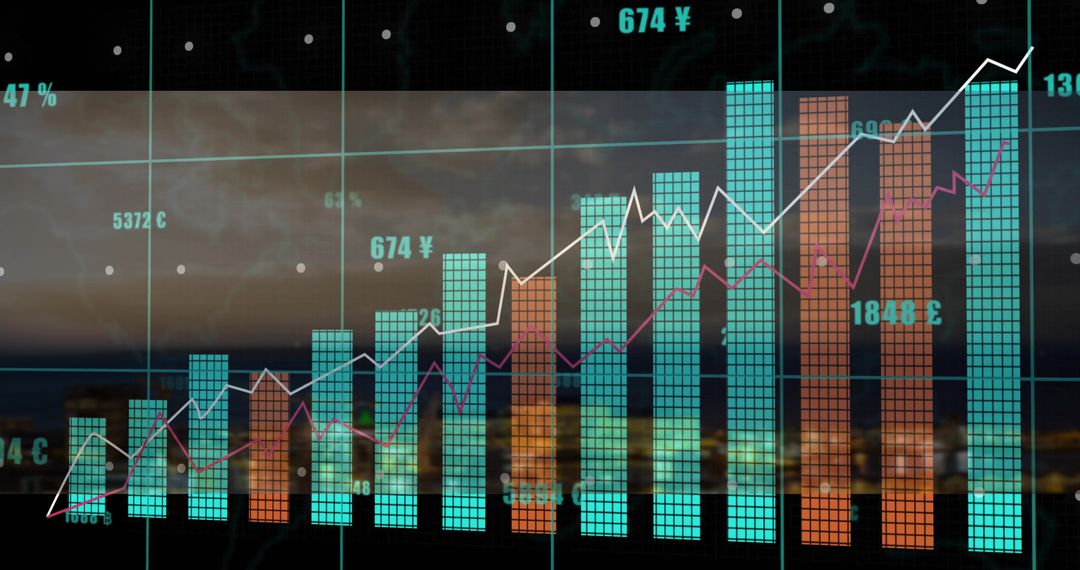
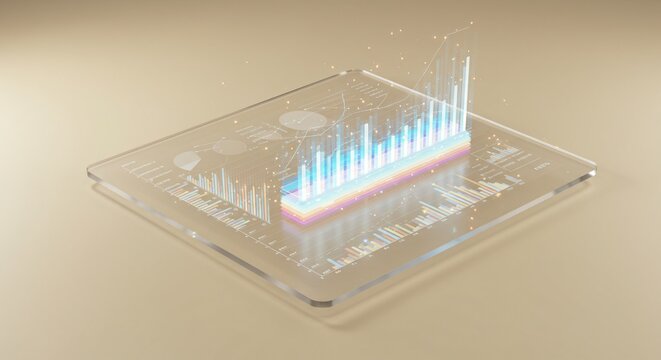
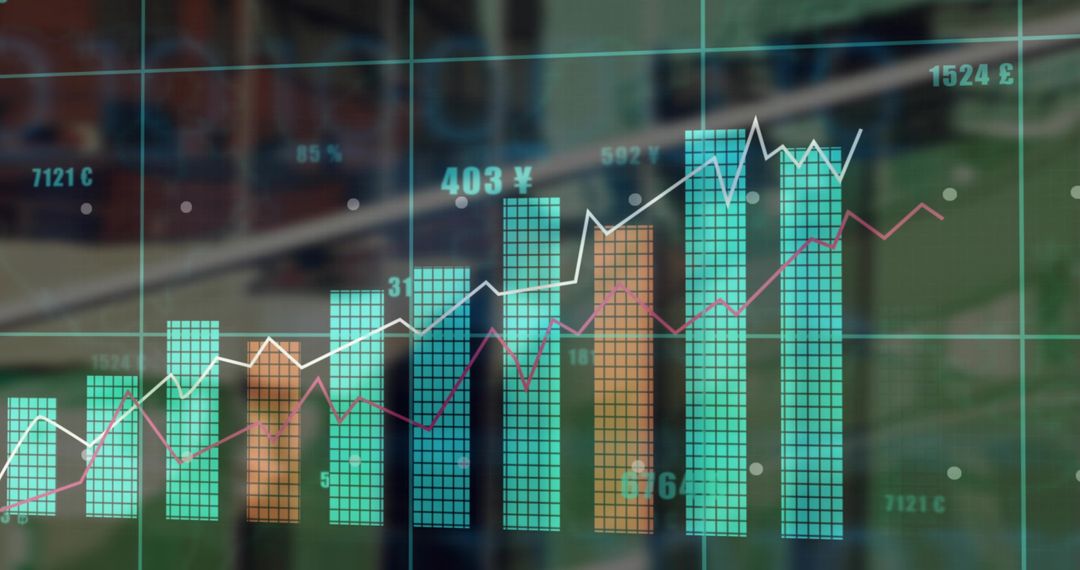
- Futuristic 3D data visualization displaying teal orange bar charts and trend lines in hologram
Futuristic 3D data visualization displaying teal orange bar charts and trend lines in hologram Image

Displaying 3D teal and orange stacked bars rising inside holographic corridor, overlaid by white and magenta trend lines and numeric readouts including yen symbol. Featuring wireframe grid, digital panels, glowing interface elements, and strong sense of depth for futuristic analytics feel. Suiting financial presentations, market reports, fintech websites, investor pitch decks, annual report covers, data dashboard mockups, and technology blog headers. Enhancing slides, website headers, social media posts, promotional banners, and product landing pages to convey growth, performance, and digital transformation. Providing high-contrast teal and orange palette for easy overlaying of text and logos; offering clear center composition for headline placement and chart annotation.
Powered by 


0
downloads
downloads
Tags:
More
Credit Photo
If you would like to credit the Photo, here are some ways you can do so
Text Link
photo Link
<span class="text-link">
<span>
<a target="_blank" href=https://pikwizard.com/photo/futuristic-3d-data-visualization-displaying-teal-orange-bar-charts-and-trend-lines-in-hologram/c53c352424ff1cf53fb18f87c2d51411/>PikWizard</a>
</span>
</span>
<span class="image-link">
<span
style="margin: 0 0 20px 0; display: inline-block; vertical-align: middle; width: 100%;"
>
<a
target="_blank"
href="https://pikwizard.com/photo/futuristic-3d-data-visualization-displaying-teal-orange-bar-charts-and-trend-lines-in-hologram/c53c352424ff1cf53fb18f87c2d51411/"
style="text-decoration: none; font-size: 10px; margin: 0;"
>
<img src="https://pikwizard.com/pw/medium/c53c352424ff1cf53fb18f87c2d51411.jpg" style="margin: 0; width: 100%;" alt="" />
<p style="font-size: 12px; margin: 0;">PikWizard</p>
</a>
</span>
</span>
Free (free of charge)
Free for personal and commercial use.
Author: Authentic Images
Similar Free Stock Images

Premium


Premium


Premium


Premium


Premium


Premium


Premium


Premium


Premium


Premium


Premium


Premium


Premium


Premium


Premium


Premium


Premium


Premium


Premium


Premium


Premium


Premium


Premium


Premium