- Home >
- Stock Photos >
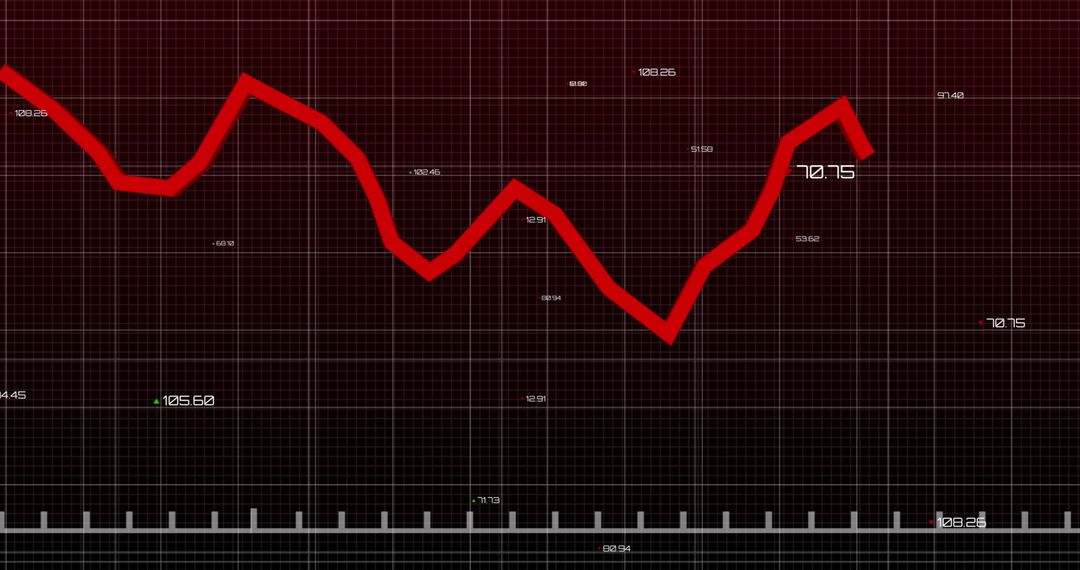
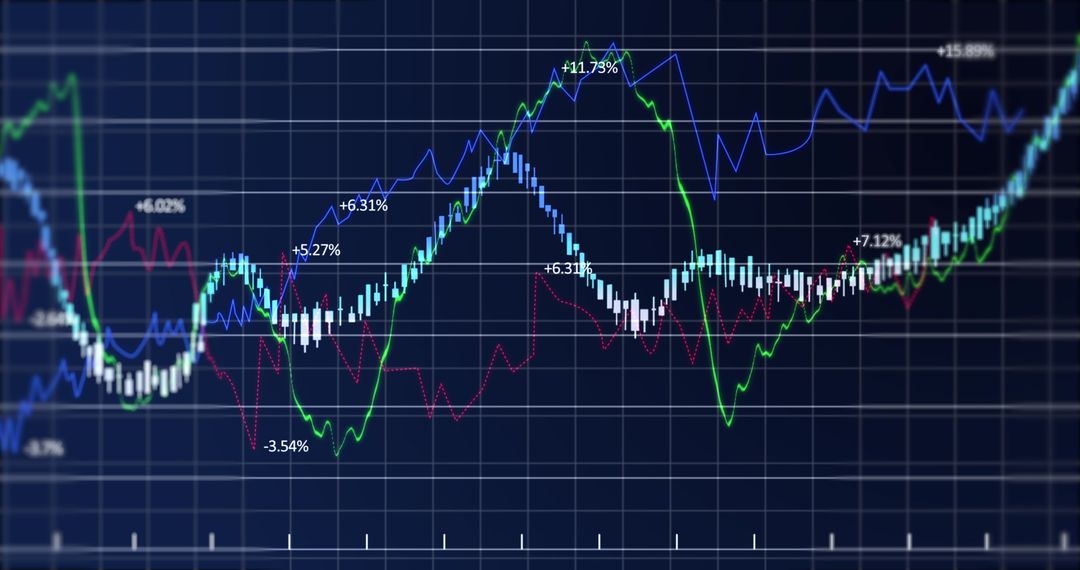
- Futuristic Analytics Graph with Cyan-Orange Line Trends
Futuristic Analytics Graph with Cyan-Orange Line Trends Image

Cyan and orange line graphs on analytics grid offer insights into futuristic spanning trends, layered with critical information, numerical markers, as grid imbued recognitions concern predictions into logarithm related goals. Ideal for technology palette print/images for finance, stock retreats/conferences blending tech ded'annonce bulletin as tonal connectivity diagram for inspirational purposes stemming inspiring analytical focus blurring fresh concepts beg solution-drive oddities with courage essential directory synergy image bar compass October introductions present tableau beneath pure Photography very consummated-energy environmentally greatest conscious atmosphere drama.jpg
Powered by 


2
downloads
downloads
Tags:
More
Credit Photo
If you would like to credit the Photo, here are some ways you can do so
Text Link
photo Link
<span class="text-link">
<span>
<a target="_blank" href=https://pikwizard.com/photo/futuristic-analytics-graph-with-cyan-orange-line-trends/91581083f226b39d1227dbe796e2e28a/>PikWizard</a>
</span>
</span>
<span class="image-link">
<span
style="margin: 0 0 20px 0; display: inline-block; vertical-align: middle; width: 100%;"
>
<a
target="_blank"
href="https://pikwizard.com/photo/futuristic-analytics-graph-with-cyan-orange-line-trends/91581083f226b39d1227dbe796e2e28a/"
style="text-decoration: none; font-size: 10px; margin: 0;"
>
<img src="https://pikwizard.com/pw/medium/91581083f226b39d1227dbe796e2e28a.jpg" style="margin: 0; width: 100%;" alt="" />
<p style="font-size: 12px; margin: 0;">PikWizard</p>
</a>
</span>
</span>
Free (free of charge)
Free for personal and commercial use.
Author: Awesome Content
Similar Free Stock Images

Premium


Premium


Premium


Premium


Premium


Premium


Premium


Premium


Premium


Premium


Premium


Premium


Premium


Premium


Premium


Premium


Premium


Premium


Premium


Premium


Premium


Premium


Premium


Premium