- Home >
- Stock Photos >
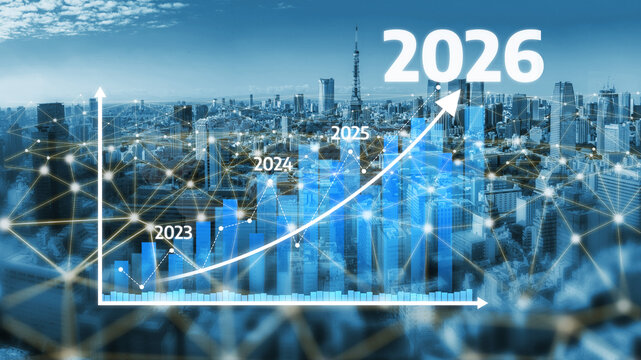
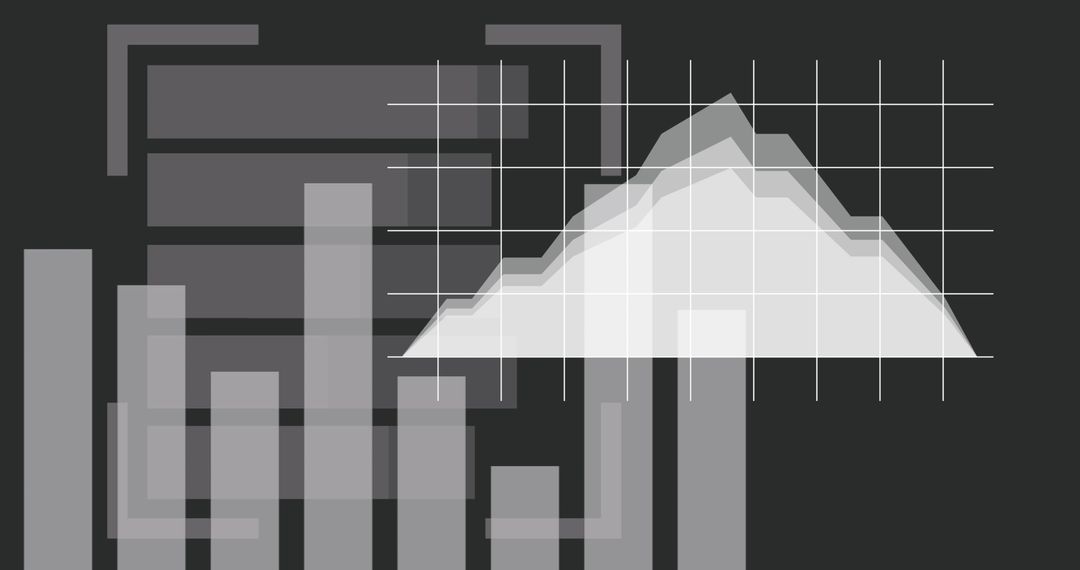
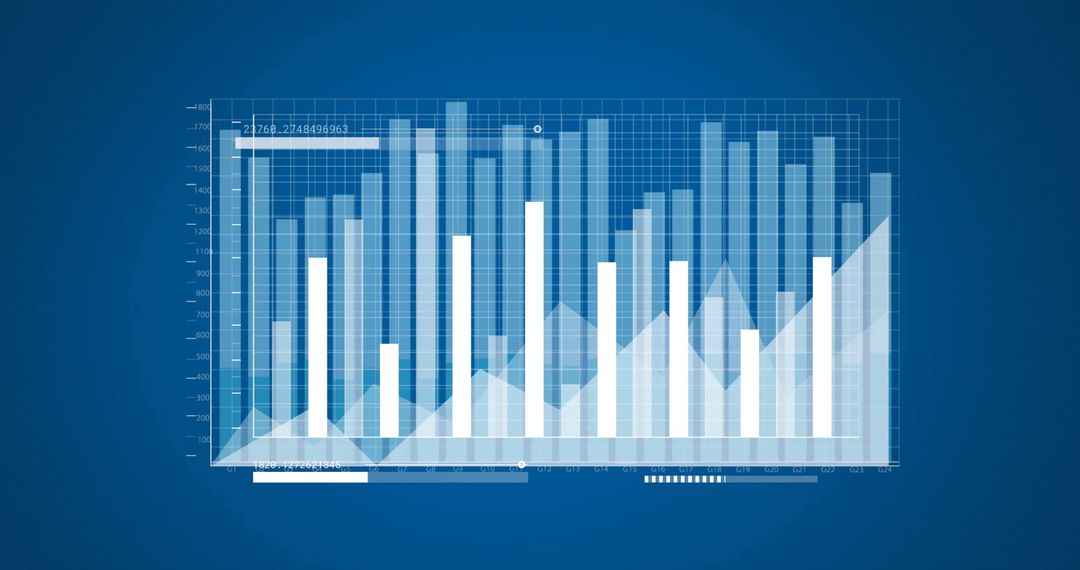
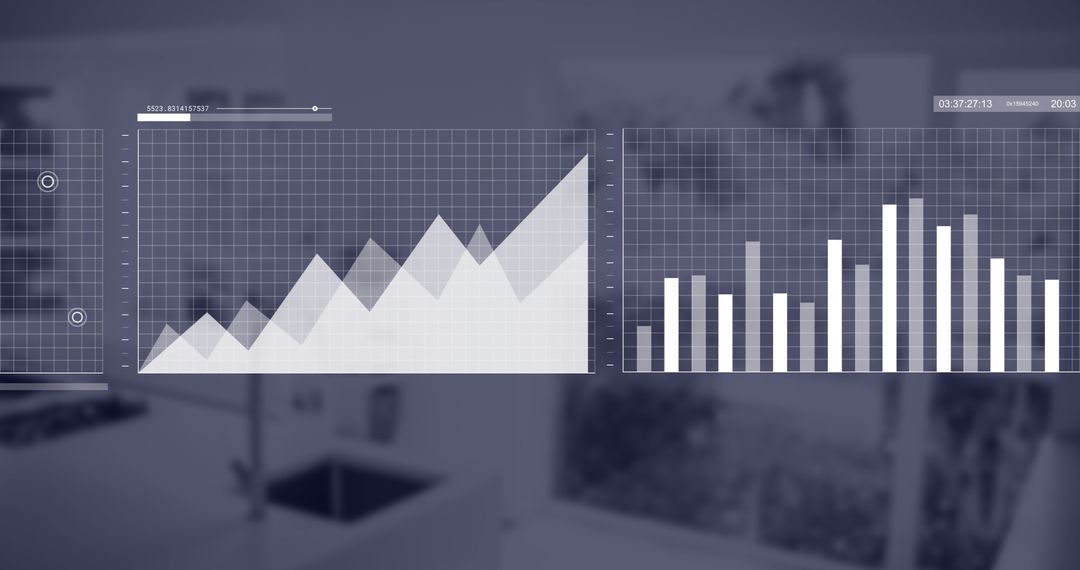
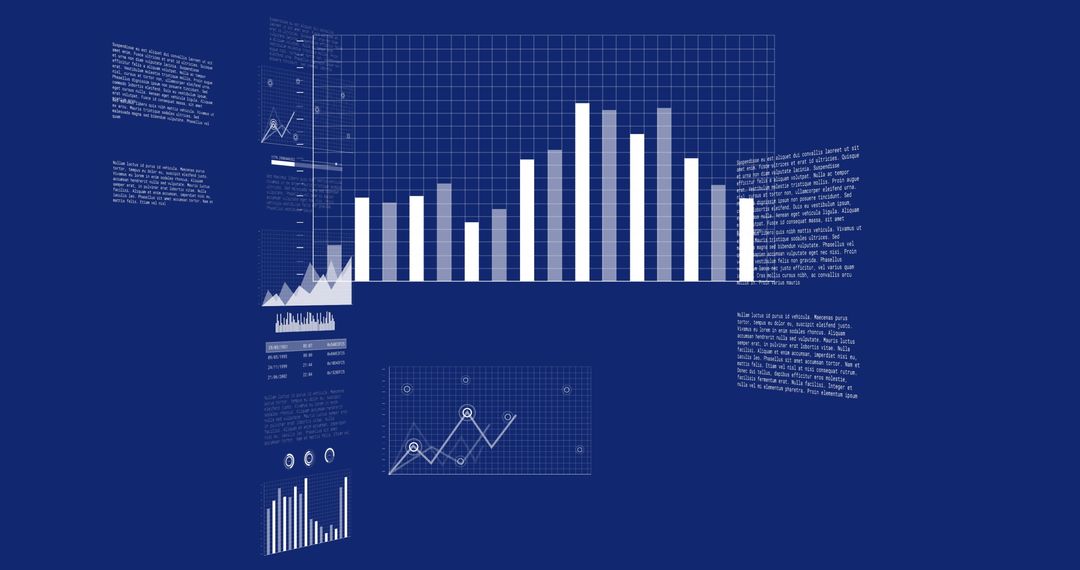
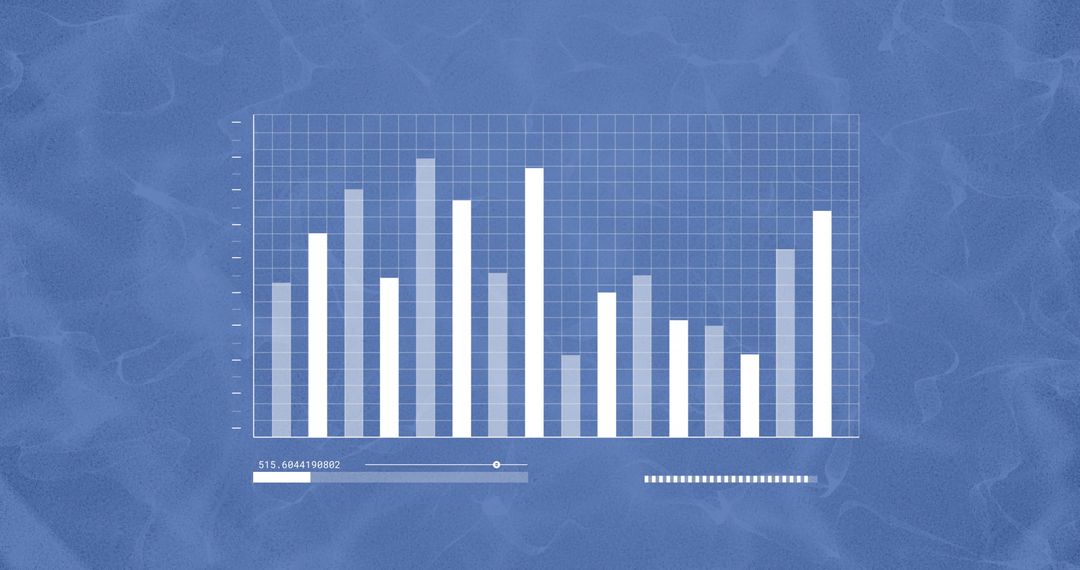
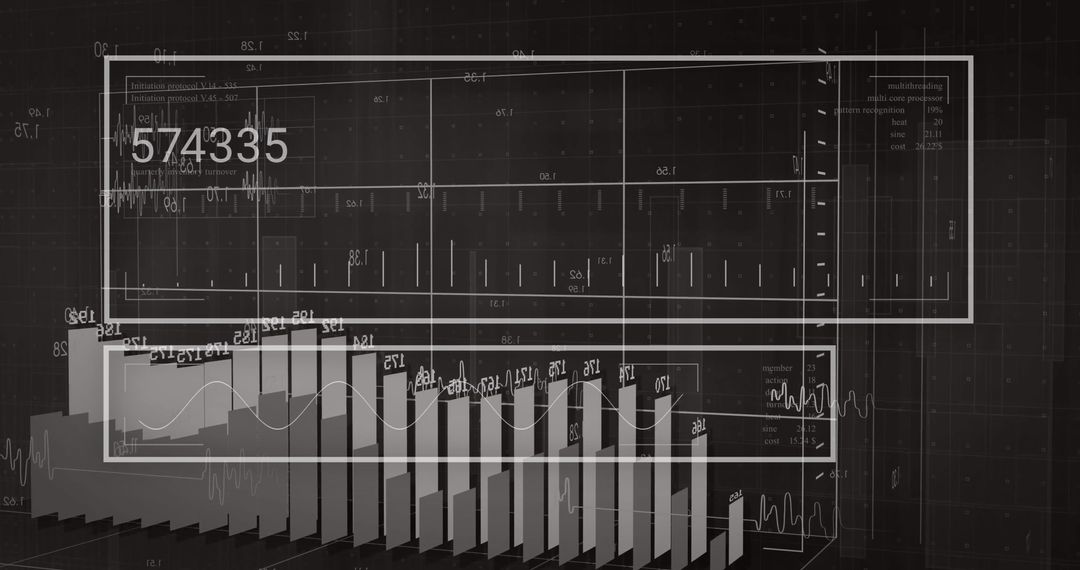
- Futuristic Business Growth Chart with Holographic Interface
Futuristic Business Growth Chart with Holographic Interface Image

Depicts a futuristic and digital representation of business data with holographic interface elements, combining traditional bar graphs and technological advancements. Ideal for representing concepts related to finance, business analysis, technology innovation, and futuristic design looks.
Powered by 


3
downloads
downloads
Tags:
More
Credit Photo
If you would like to credit the Photo, here are some ways you can do so
Text Link
photo Link
<span class="text-link">
<span>
<a target="_blank" href=https://pikwizard.com/photo/futuristic-business-growth-chart-with-holographic-interface/e35d5770a41dc4ea46a50235d4bee061/>PikWizard</a>
</span>
</span>
<span class="image-link">
<span
style="margin: 0 0 20px 0; display: inline-block; vertical-align: middle; width: 100%;"
>
<a
target="_blank"
href="https://pikwizard.com/photo/futuristic-business-growth-chart-with-holographic-interface/e35d5770a41dc4ea46a50235d4bee061/"
style="text-decoration: none; font-size: 10px; margin: 0;"
>
<img src="https://pikwizard.com/pw/medium/e35d5770a41dc4ea46a50235d4bee061.jpg" style="margin: 0; width: 100%;" alt="" />
<p style="font-size: 12px; margin: 0;">PikWizard</p>
</a>
</span>
</span>
Free (free of charge)
Free for personal and commercial use.
Author: Awesome Content
Similar Free Stock Images
Premium


Premium


Premium


Premium


Premium


Premium


Premium


Premium


Premium


Premium


Premium


Premium


Premium


Premium


Premium


Premium


Premium


Premium


Premium


Premium


Premium


Premium


Premium


Premium