- Home >
- Stock Photos >
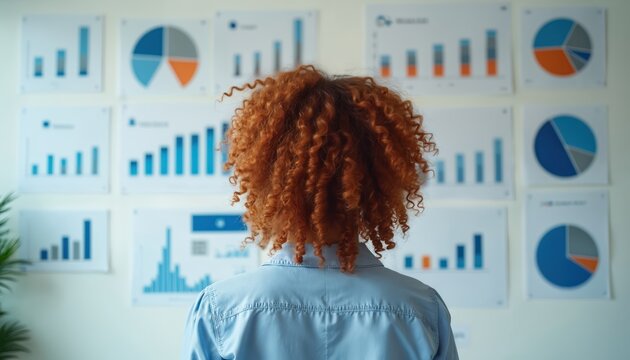
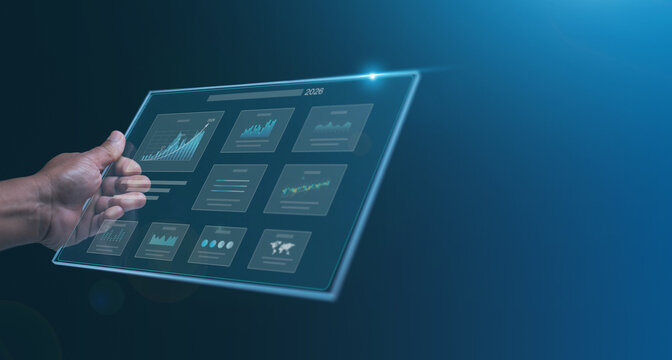
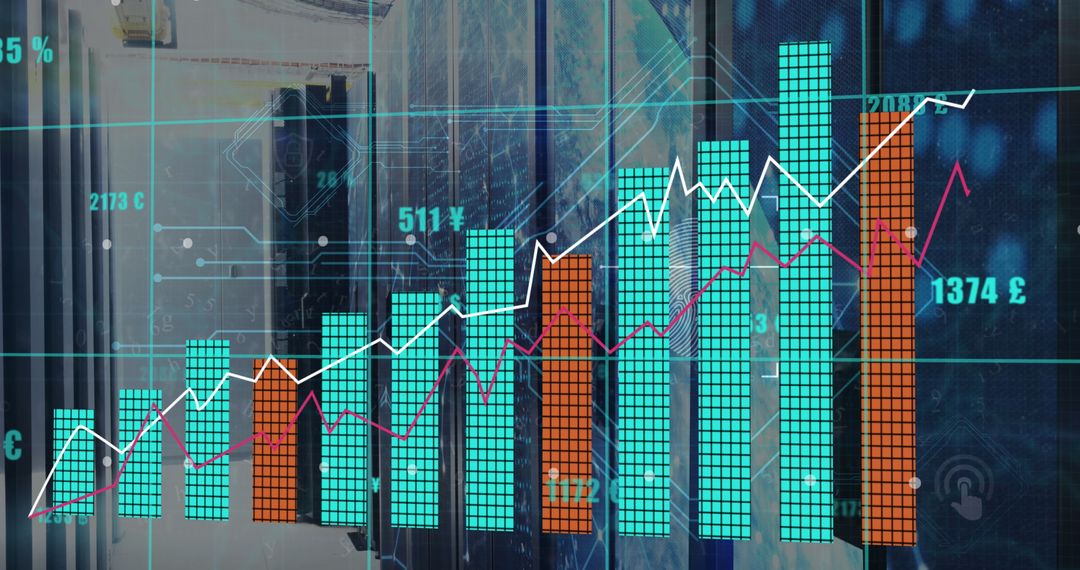
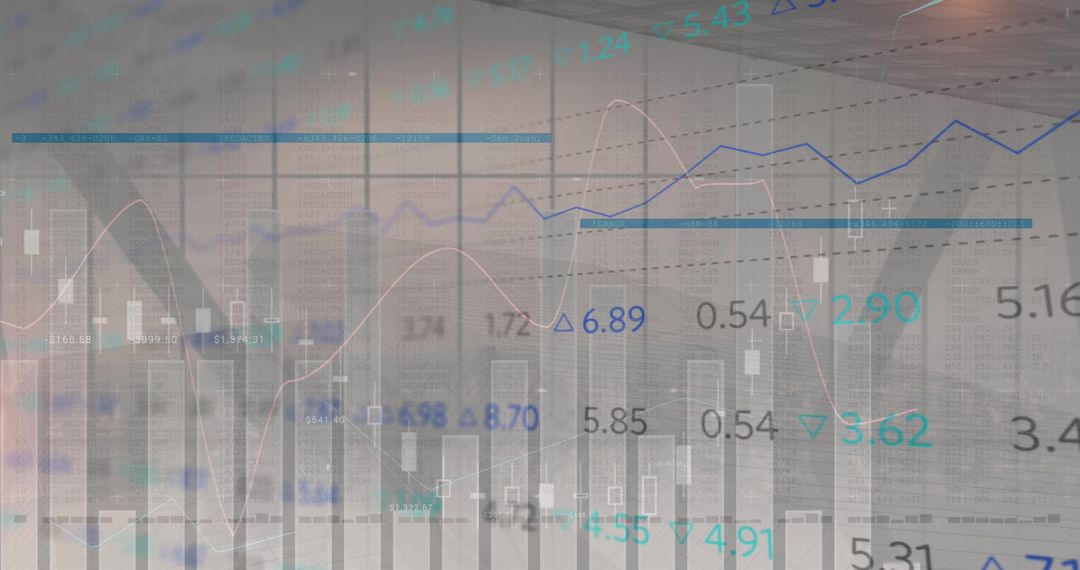
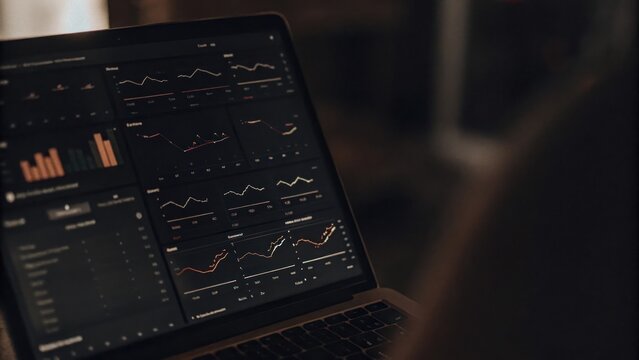
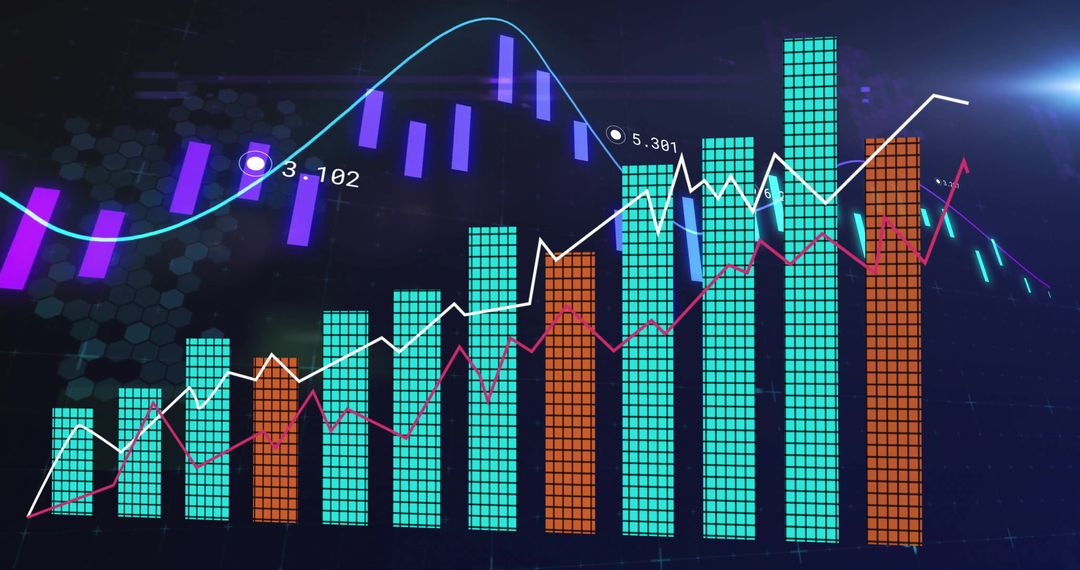
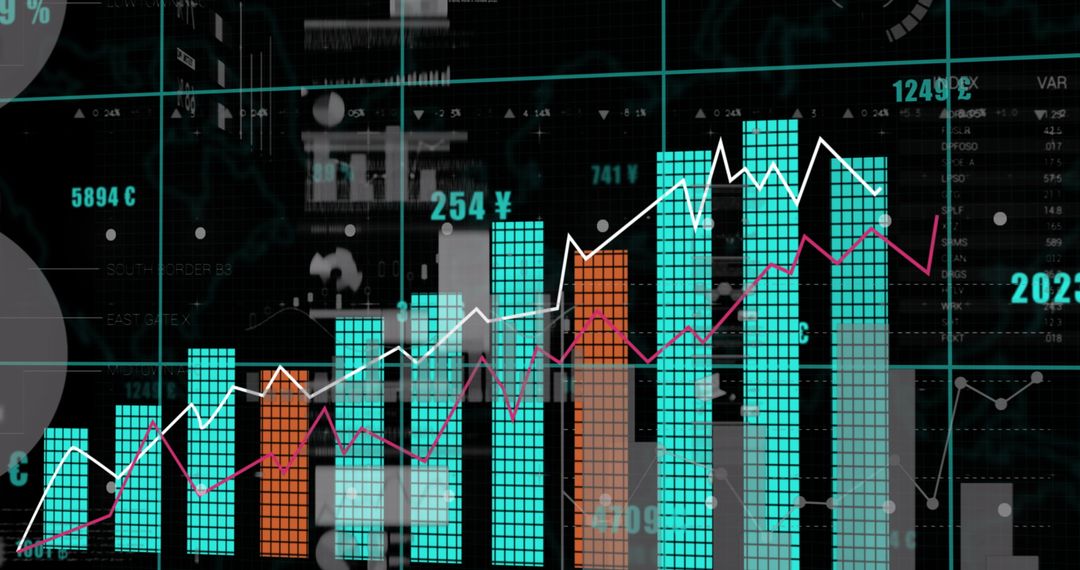
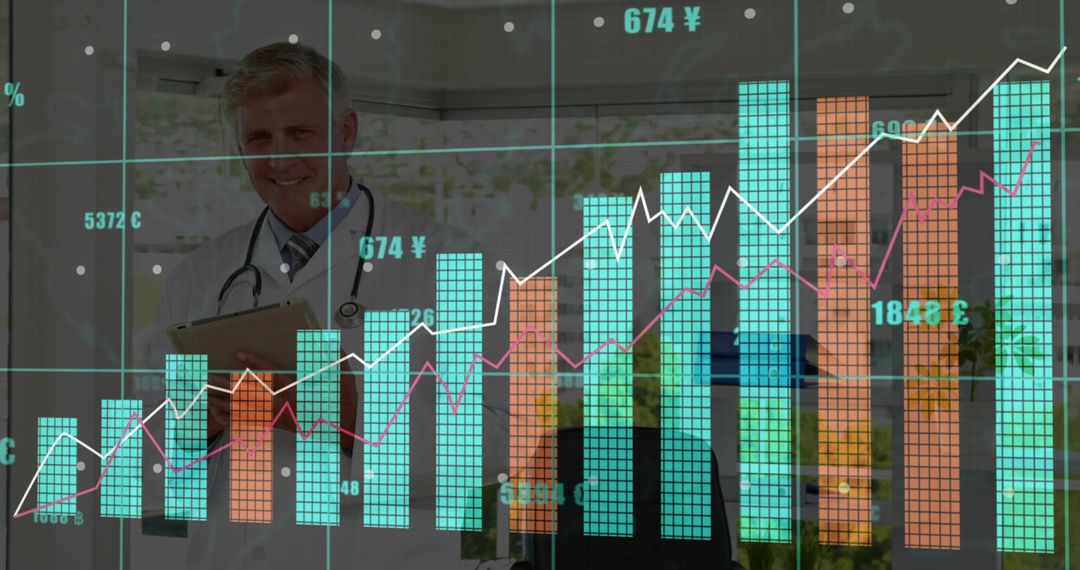
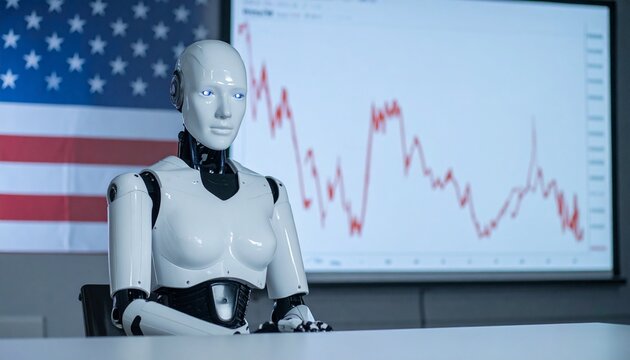
- Futuristic Data and Financial Analysis in Modern Office Environment
Futuristic Data and Financial Analysis in Modern Office Environment Image

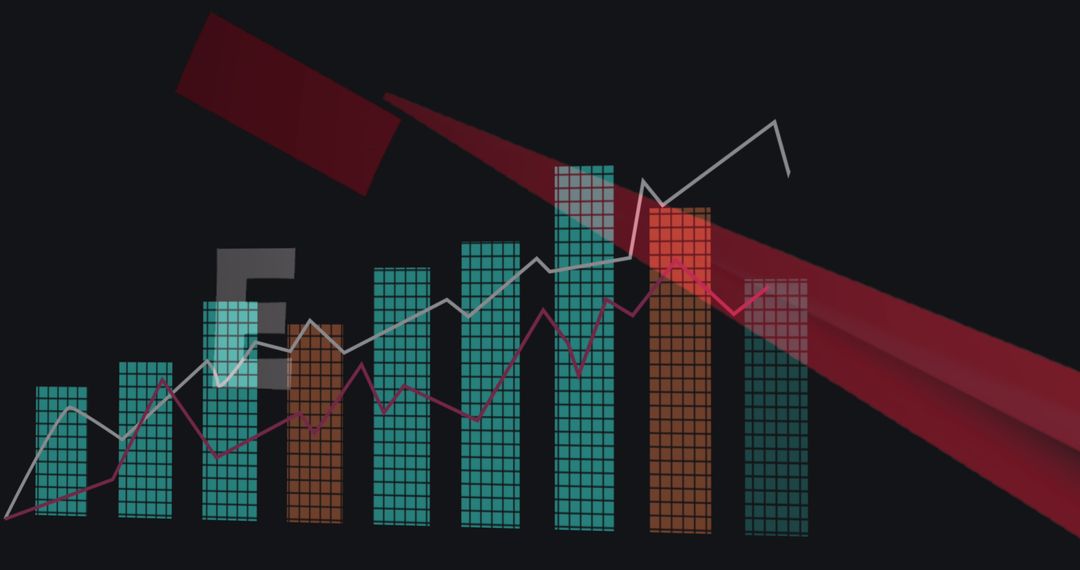
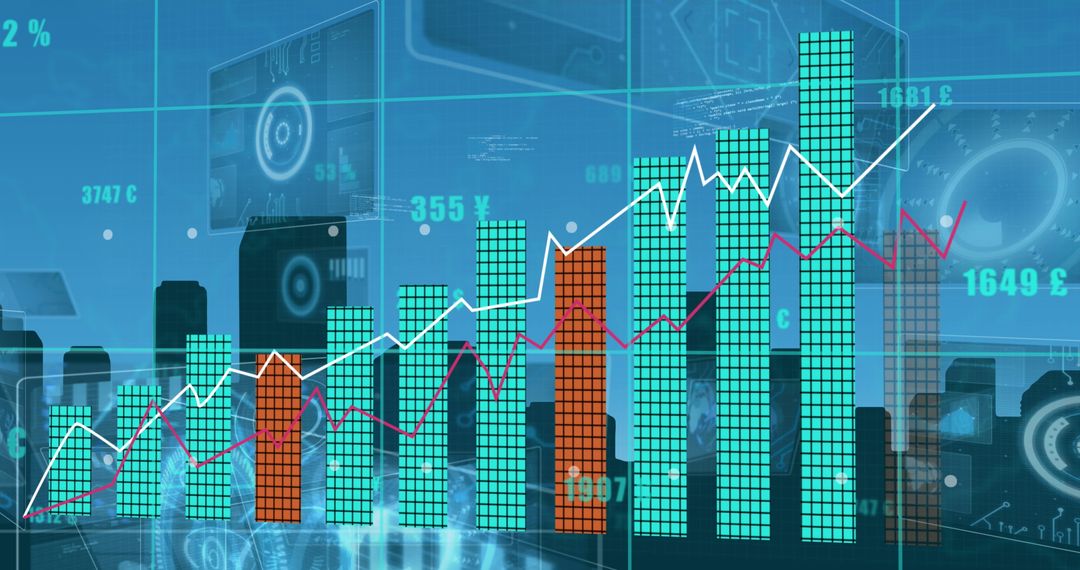
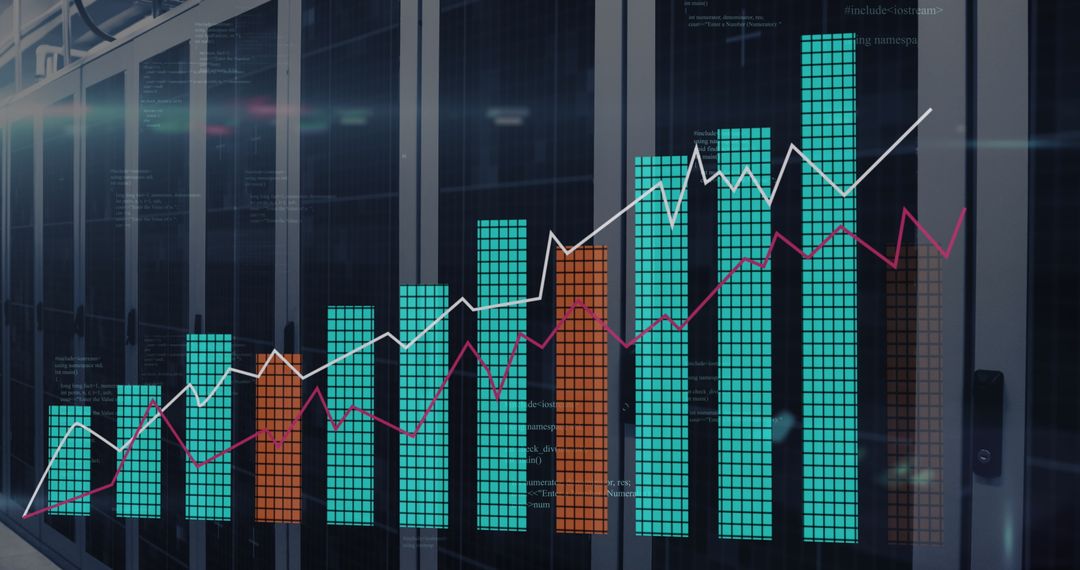
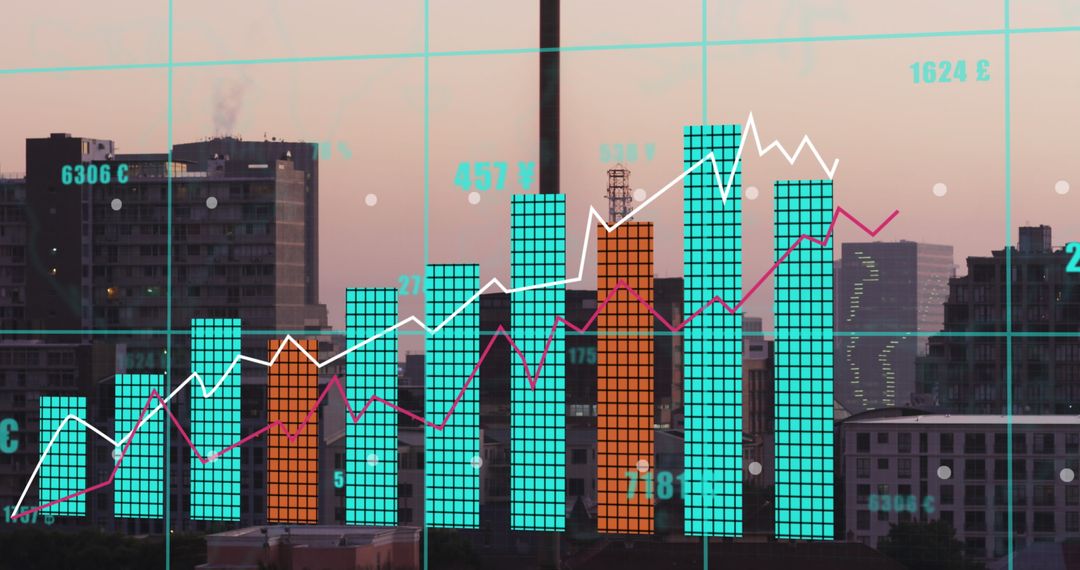
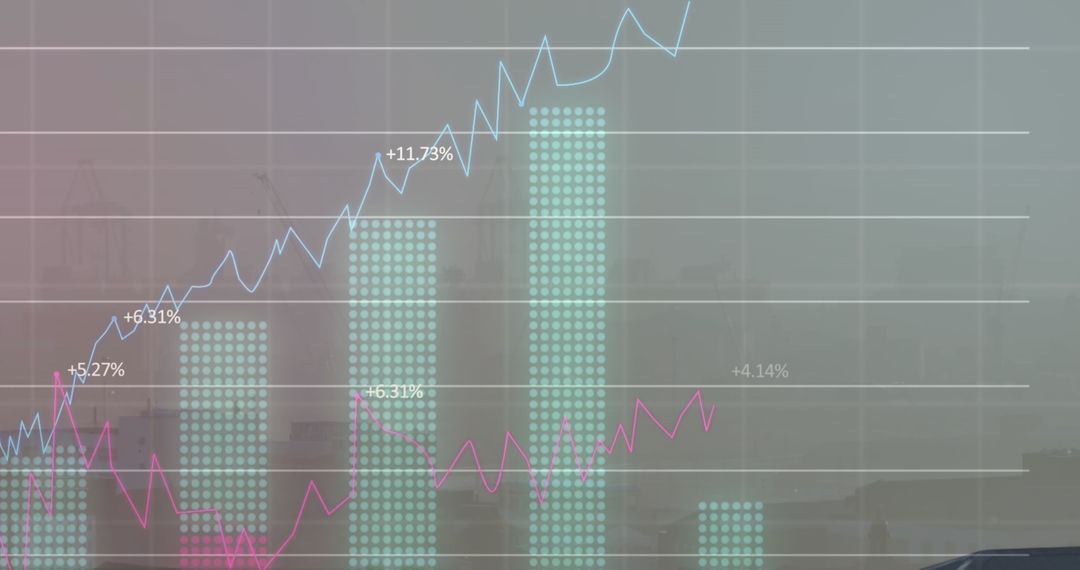
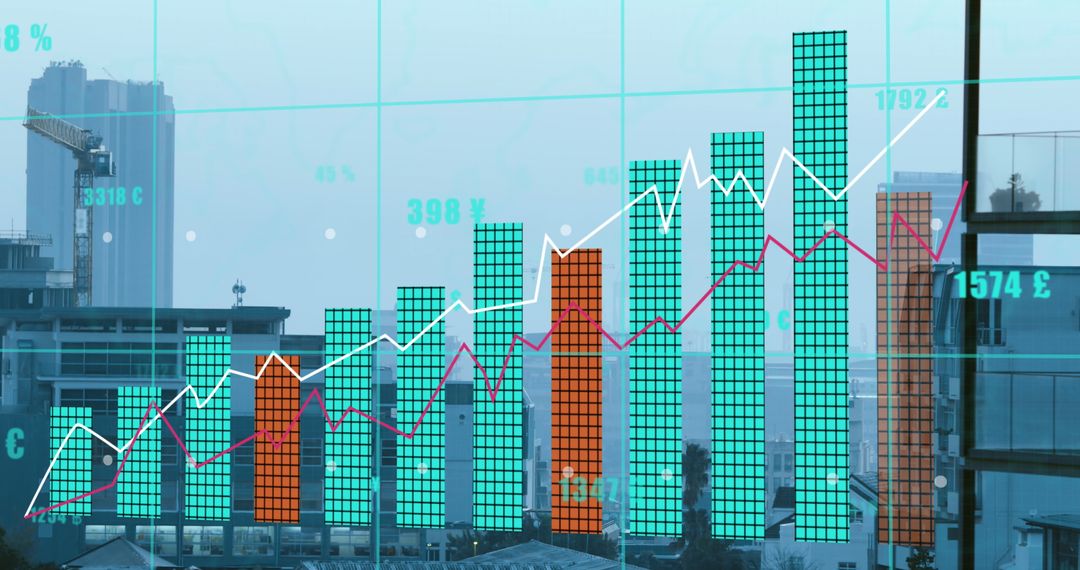
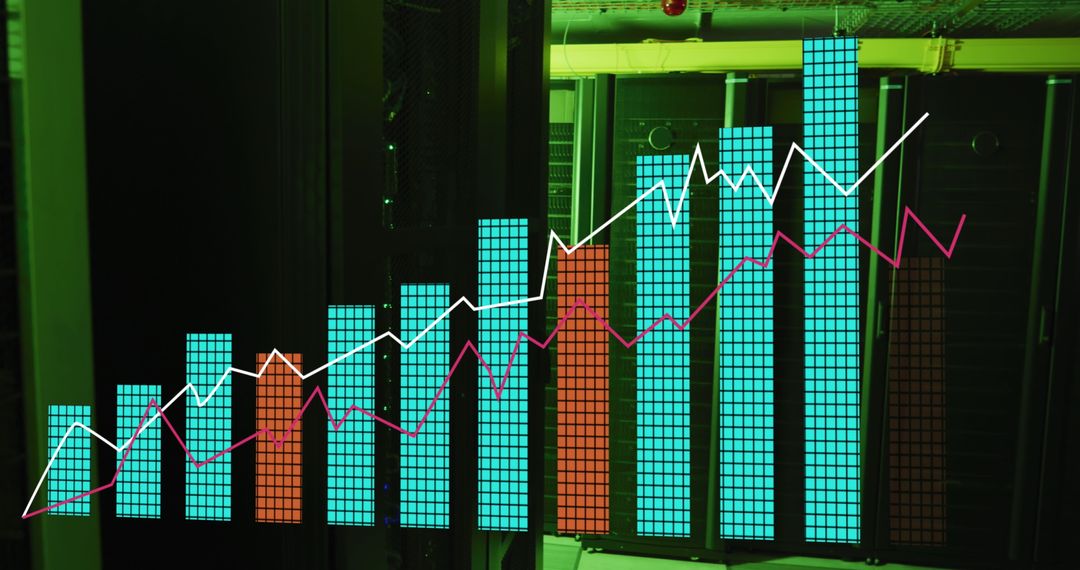
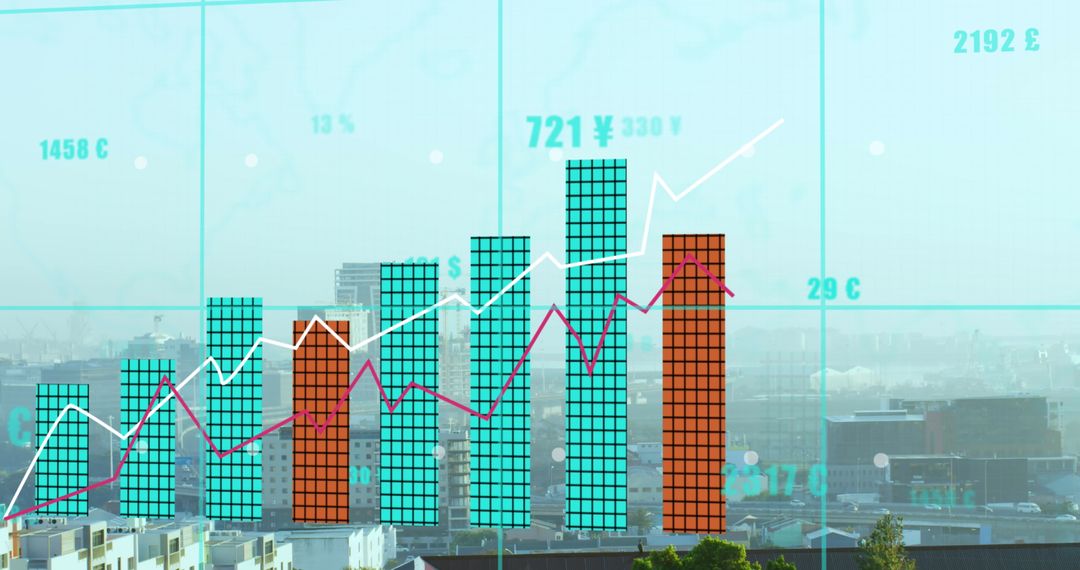
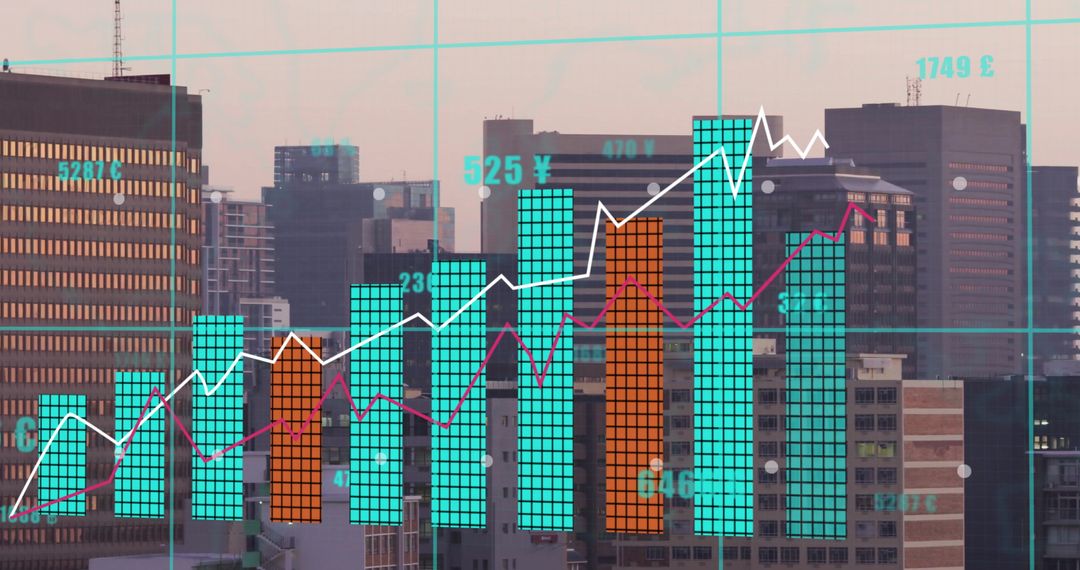
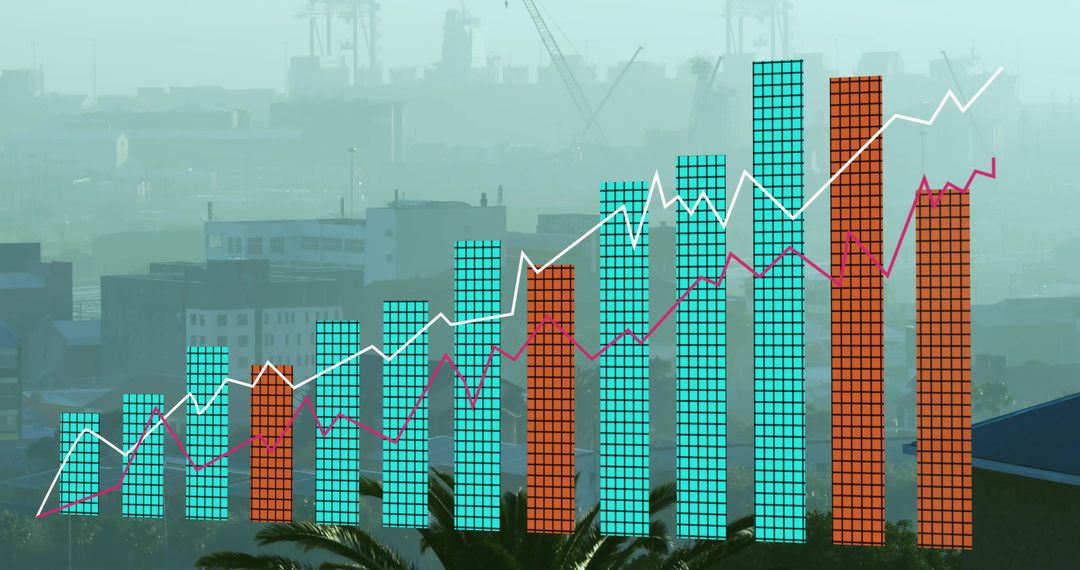
Abstract visual representation of various financial data and statistics merging with a contemporary office background, emphasizes the integration of technology in business environments. Useful for illustrating concepts in financial reports, presentations about business analytics, or articles on economic forecasting capabilities.
Powered by 


2
downloads
downloads
Tags:
More
Credit Photo
If you would like to credit the Photo, here are some ways you can do so
Text Link
photo Link
<span class="text-link">
<span>
<a target="_blank" href=https://pikwizard.com/photo/futuristic-data-and-financial-analysis-in-modern-office-environment/cd025d30bb947b9cd6140468308aeae9/>PikWizard</a>
</span>
</span>
<span class="image-link">
<span
style="margin: 0 0 20px 0; display: inline-block; vertical-align: middle; width: 100%;"
>
<a
target="_blank"
href="https://pikwizard.com/photo/futuristic-data-and-financial-analysis-in-modern-office-environment/cd025d30bb947b9cd6140468308aeae9/"
style="text-decoration: none; font-size: 10px; margin: 0;"
>
<img src="https://pikwizard.com/pw/medium/cd025d30bb947b9cd6140468308aeae9.jpg" style="margin: 0; width: 100%;" alt="" />
<p style="font-size: 12px; margin: 0;">PikWizard</p>
</a>
</span>
</span>
Free (free of charge)
Free for personal and commercial use.
Author: Creative Art
Similar Free Stock Images

Premium


Premium


Premium


Premium


Premium


Premium


Premium


Premium


Premium


Premium


Premium


Premium


Premium


Premium
Premium


Premium


Premium


Premium


Premium


Premium


Premium


Premium


Premium


Premium