- Home >
- Stock Photos >
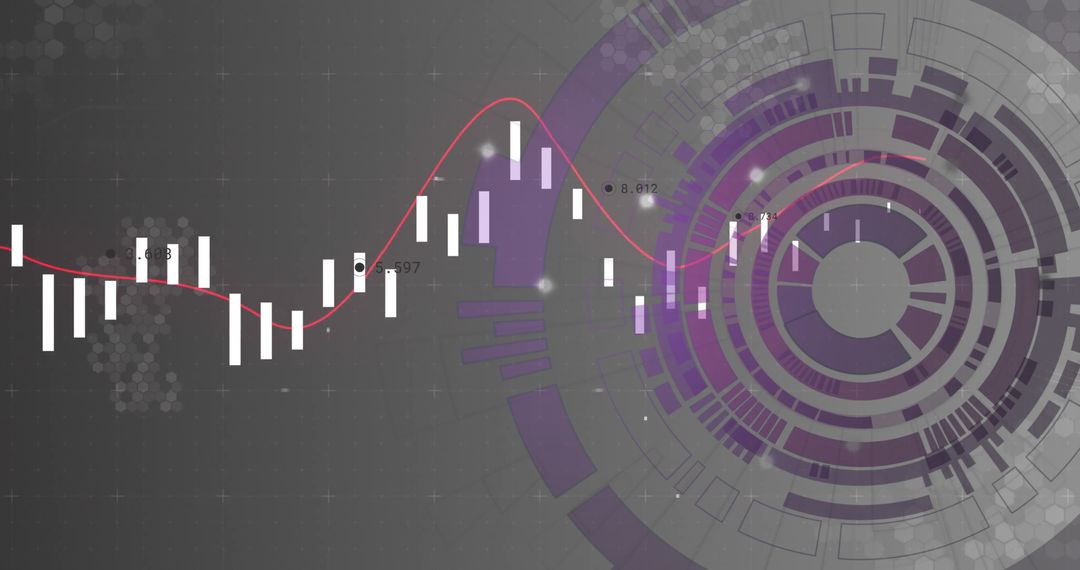
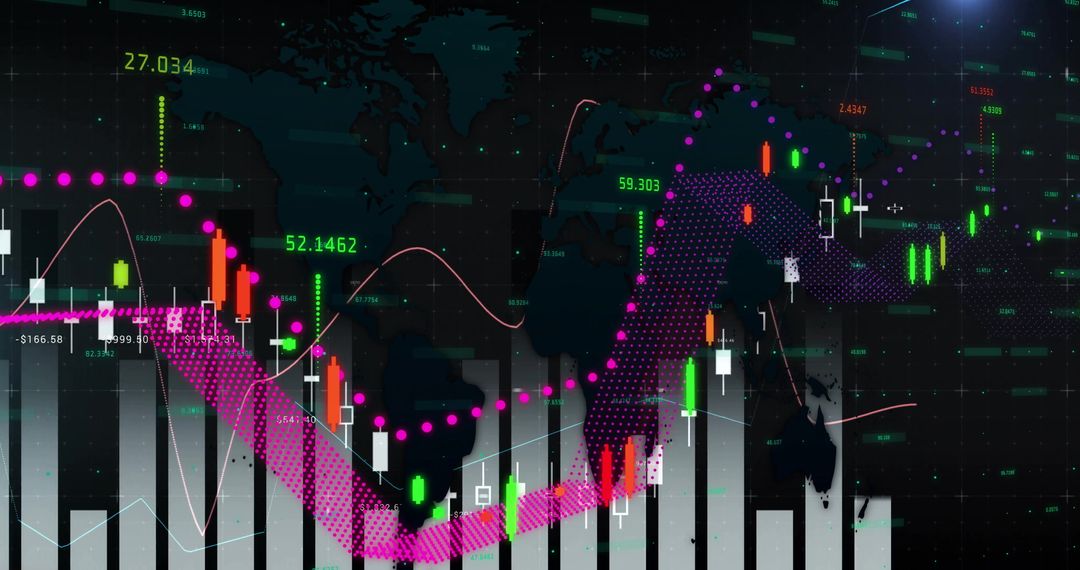
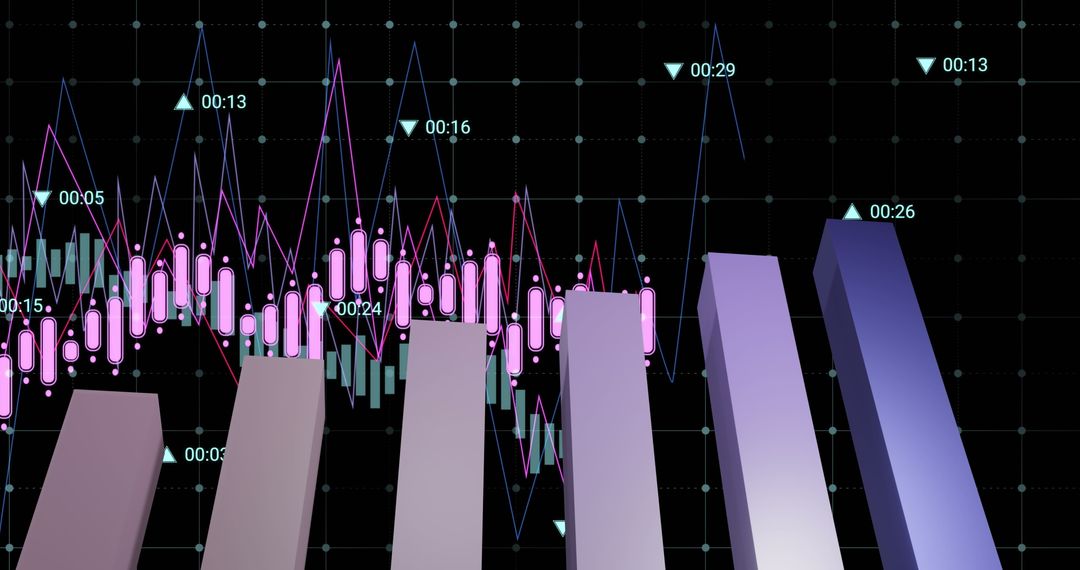
- Futuristic Data Dashboard Displaying Layered Analytics with Neon Magenta Circular Visualizations
Futuristic Data Dashboard Displaying Layered Analytics with Neon Magenta Circular Visualizations Image

Composition displaying layered digital dashboard with translucent bar charts, line graphs, and concentric magenta rings over dark grid. Timeline markers labeled 2008 and 2015 providing historical comparison points and trend emphasis. Visual language combining HUD-style elements with neon magenta and purple tones for modern analytics aesthetic. Ideal for fintech, business intelligence, data science, and technology branding. Suggested uses include website hero banners, corporate slide decks and presentation covers, annual reports and whitepapers, marketing materials for analytics platforms, blog headers and social posts, video backgrounds and UI mockups. File allowing cropping and overlaying of headlines or logos while preserving central circular elements for strong focal point.
Powered by  - Get 15% off with code: PIKWIZARD15


0
downloads
downloads
Tags:
More
Credit Photo
If you would like to credit the Photo, here are some ways you can do so
Text Link
photo Link
<span class="text-link">
<span>
<a target="_blank" href=https://pikwizard.com/photo/futuristic-data-dashboard-displaying-layered-analytics-with-neon-magenta-circular-visualizations/ab6286b03374849e289daf874cf4dd33/>PikWizard</a>
</span>
</span>
<span class="image-link">
<span
style="margin: 0 0 20px 0; display: inline-block; vertical-align: middle; width: 100%;"
>
<a
target="_blank"
href="https://pikwizard.com/photo/futuristic-data-dashboard-displaying-layered-analytics-with-neon-magenta-circular-visualizations/ab6286b03374849e289daf874cf4dd33/"
style="text-decoration: none; font-size: 10px; margin: 0;"
>
<img src="https://pikwizard.com/pw/medium/ab6286b03374849e289daf874cf4dd33.jpg" style="margin: 0; width: 100%;" alt="" />
<p style="font-size: 12px; margin: 0;">PikWizard</p>
</a>
</span>
</span>
Free (free of charge)
Free for personal and commercial use.
Author: People Creations
Similar Free Stock Images

Premium


Premium


Premium


Premium


Premium


Premium


Premium


Premium


Premium


Premium


Premium


Premium


Premium


Premium


Premium


Premium


Premium


Premium


Premium


Premium


Premium


Premium


Premium


Premium