- Home >
- Stock Photos >
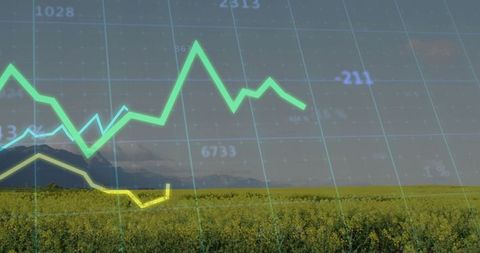
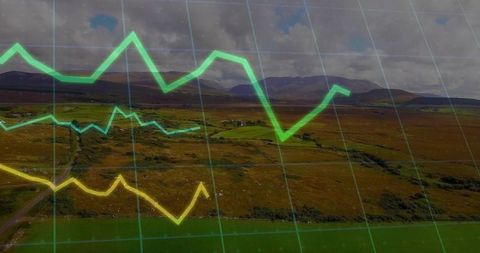
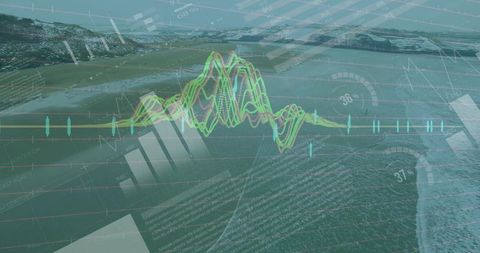
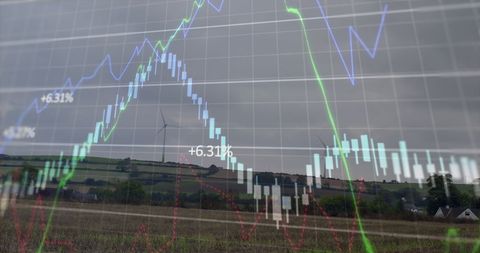
- Futuristic Data Dashboard Overlaying Scenic Nature Landscape
Futuristic Data Dashboard Overlaying Scenic Nature Landscape Image
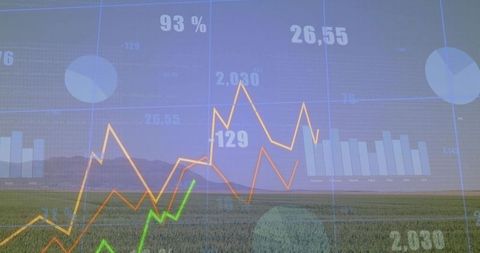
A complex data dashboard overlays a picturesque scene of a field with mountains in the background, showcasing transparent graphs and charts. This conceptual representation highlights the integration of technology and environment, illustrating how data analytics may contribute to sustainable agriculture and environmental monitoring. Could be used for presentations, articles, or websites focusing on innovative agriculture, environmental science, or data technology solutions.
Powered by  - Get 15% off with code: PIKWIZARD15


0
downloads
downloads
Tags:
More
Credit Photo
If you would like to credit the Photo, here are some ways you can do so
Text Link
photo Link
<span class="text-link">
<span>
<a target="_blank" href=https://pikwizard.com/photo/futuristic-data-dashboard-overlaying-scenic-nature-landscape/57ebc6ffbbc7291a8be3a59c27870910/>PikWizard</a>
</span>
</span>
<span class="image-link">
<span
style="margin: 0 0 20px 0; display: inline-block; vertical-align: middle; width: 100%;"
>
<a
target="_blank"
href="https://pikwizard.com/photo/futuristic-data-dashboard-overlaying-scenic-nature-landscape/57ebc6ffbbc7291a8be3a59c27870910/"
style="text-decoration: none; font-size: 10px; margin: 0;"
>
<img src="https://pikwizard.com/pw/medium/57ebc6ffbbc7291a8be3a59c27870910.jpg" style="margin: 0; width: 100%;" alt="" />
<p style="font-size: 12px; margin: 0;">PikWizard</p>
</a>
</span>
</span>
Free (free of charge)
Free for personal and commercial use.
Author: Authentic Images
Similar Free Stock Images

Premium


Premium


Premium


Premium


Premium


Premium


Premium


Premium


Premium


Premium


Premium


Premium


Premium


Premium


Premium


Premium


Premium


Premium


Premium


Premium


Premium


Premium


Premium


Premium


Premium