- Home >
- Stock Photos >
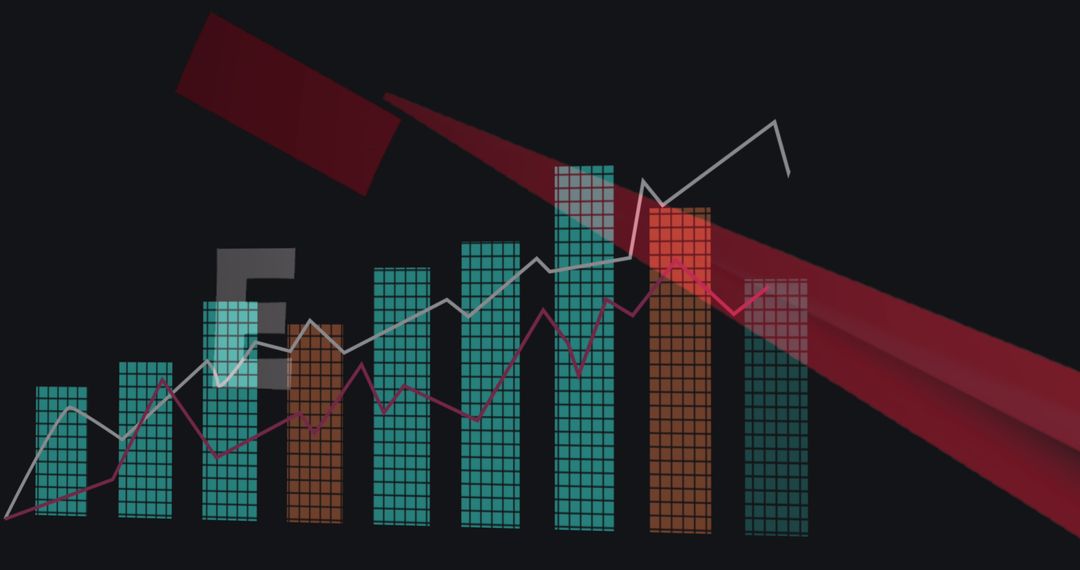
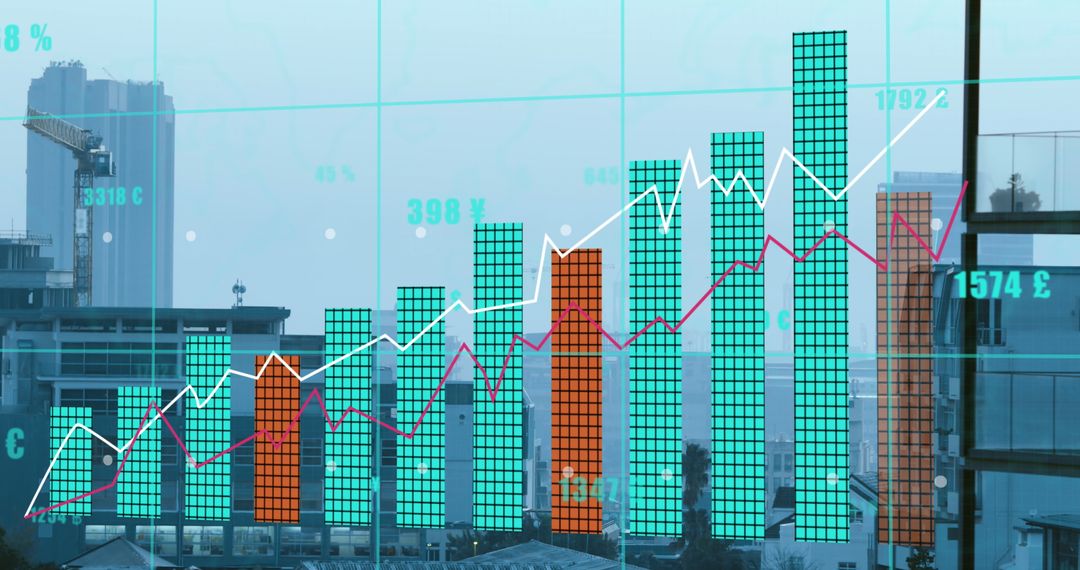
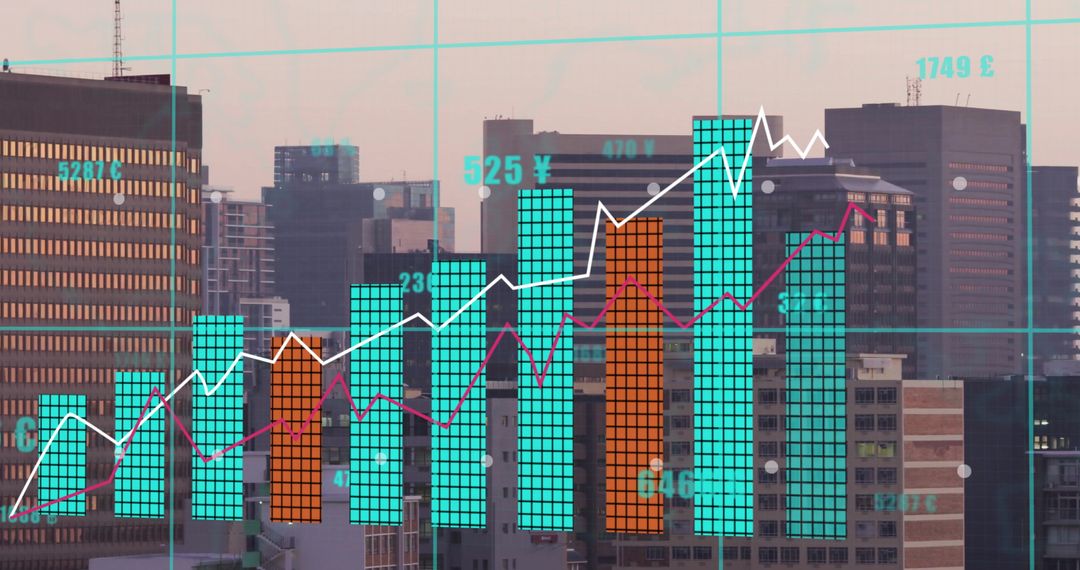
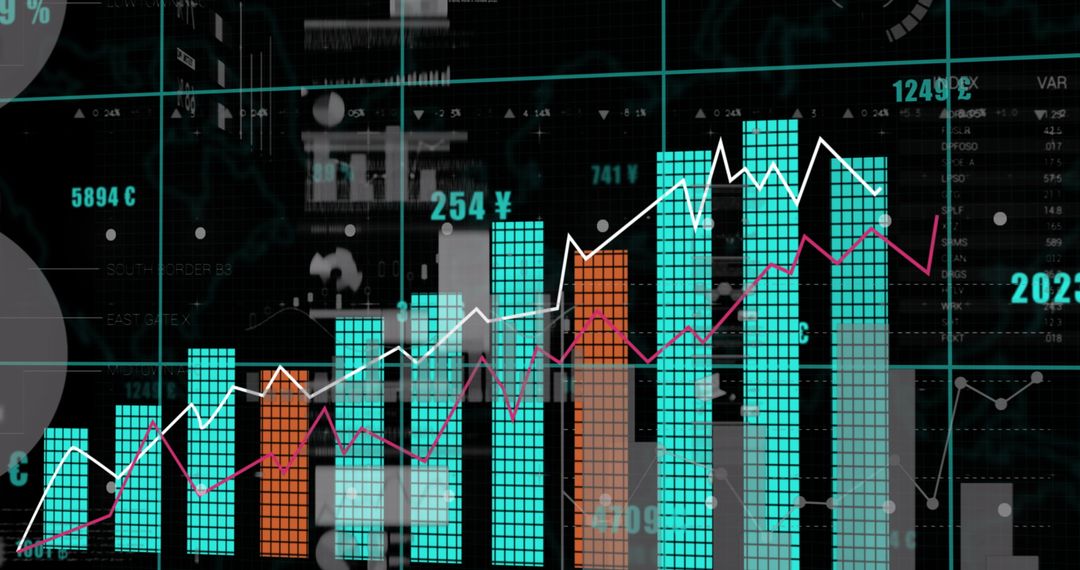
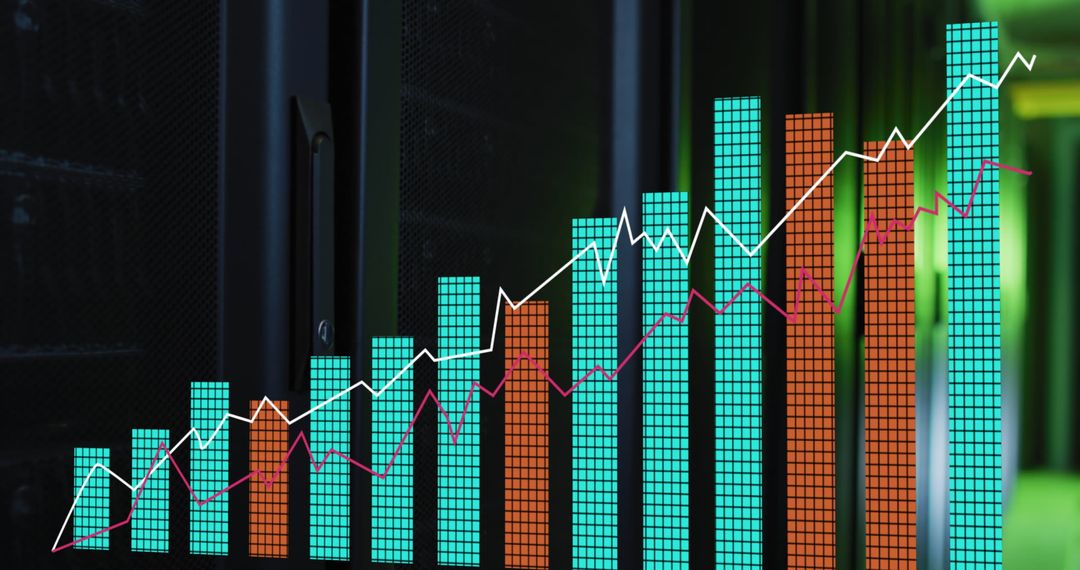
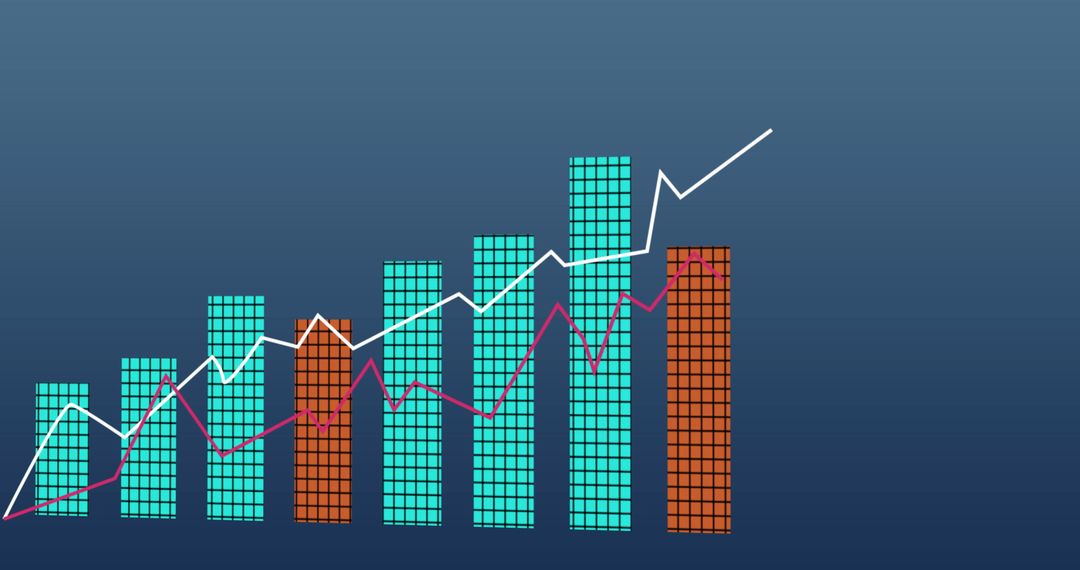
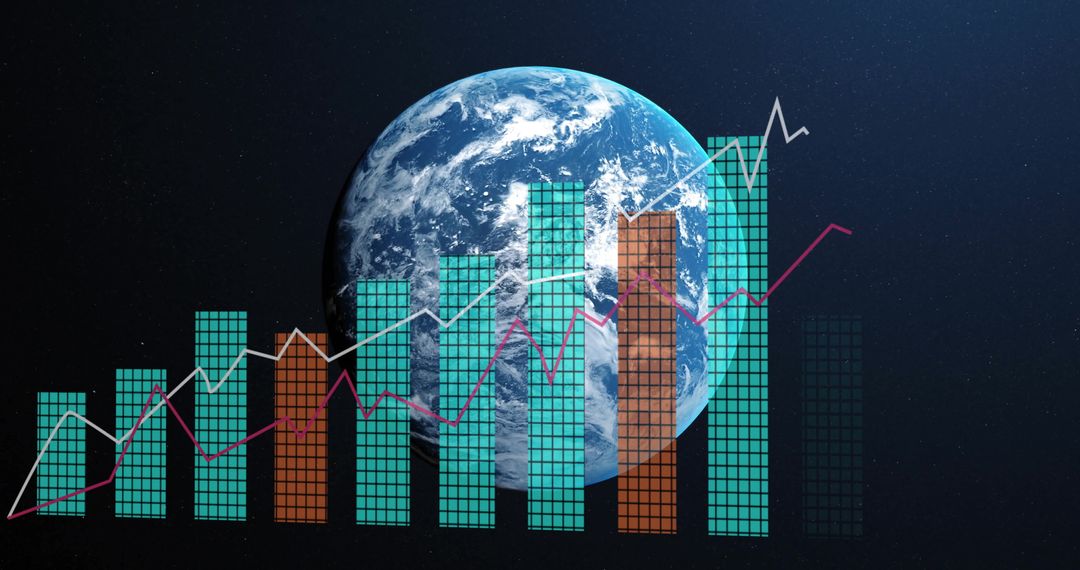
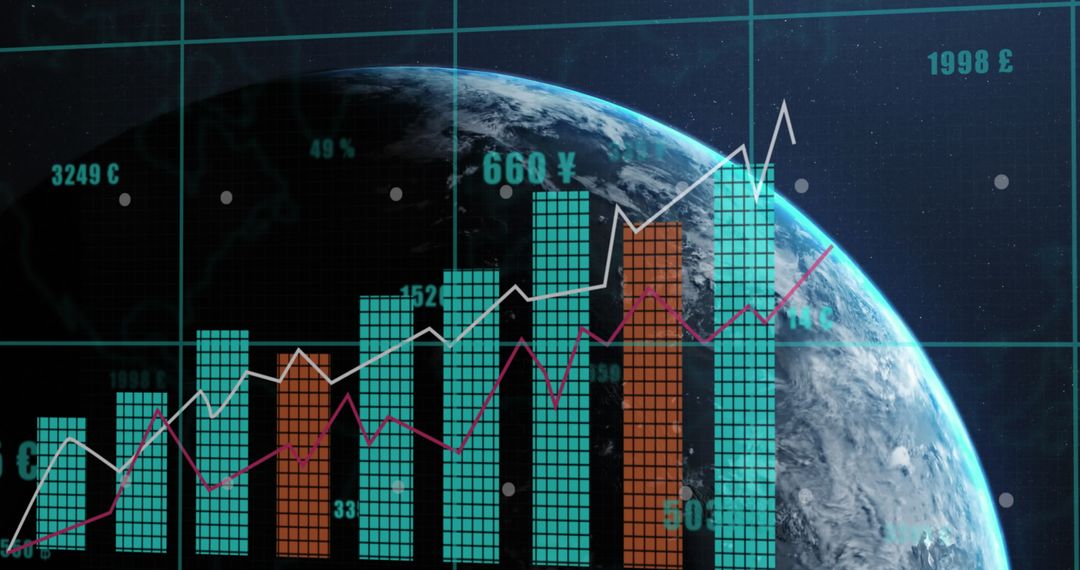
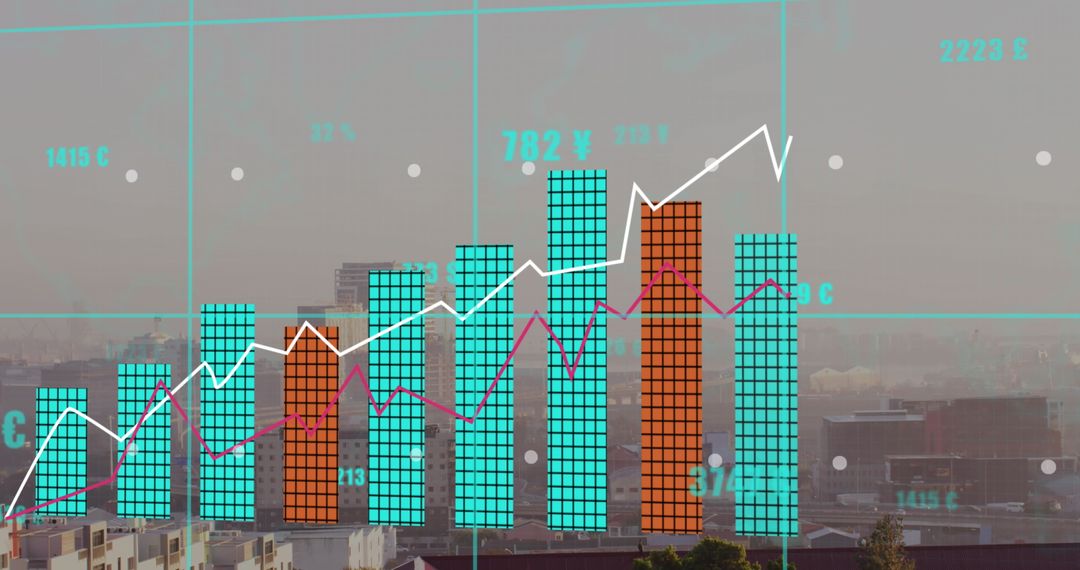
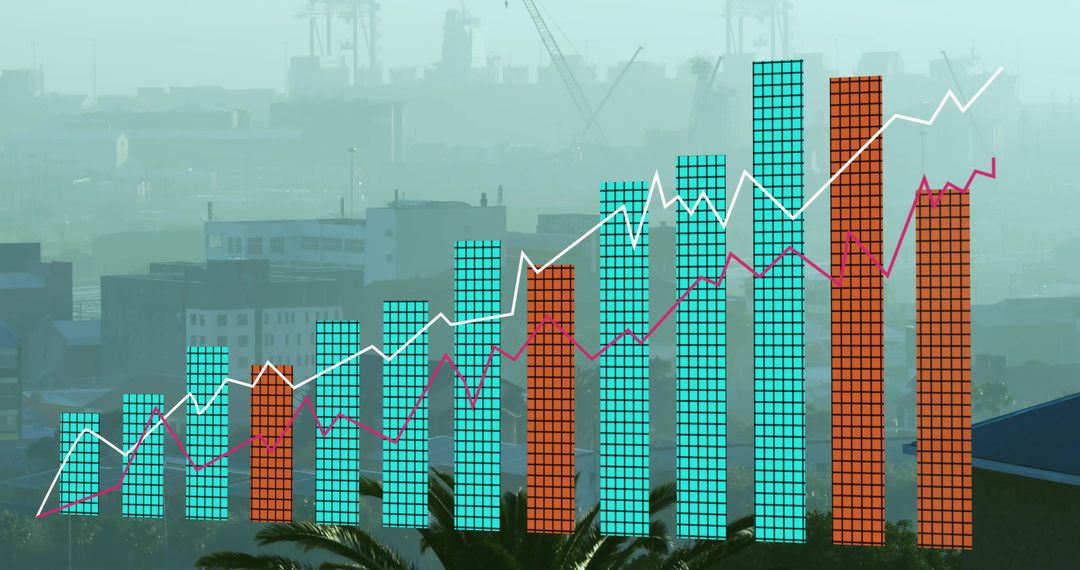
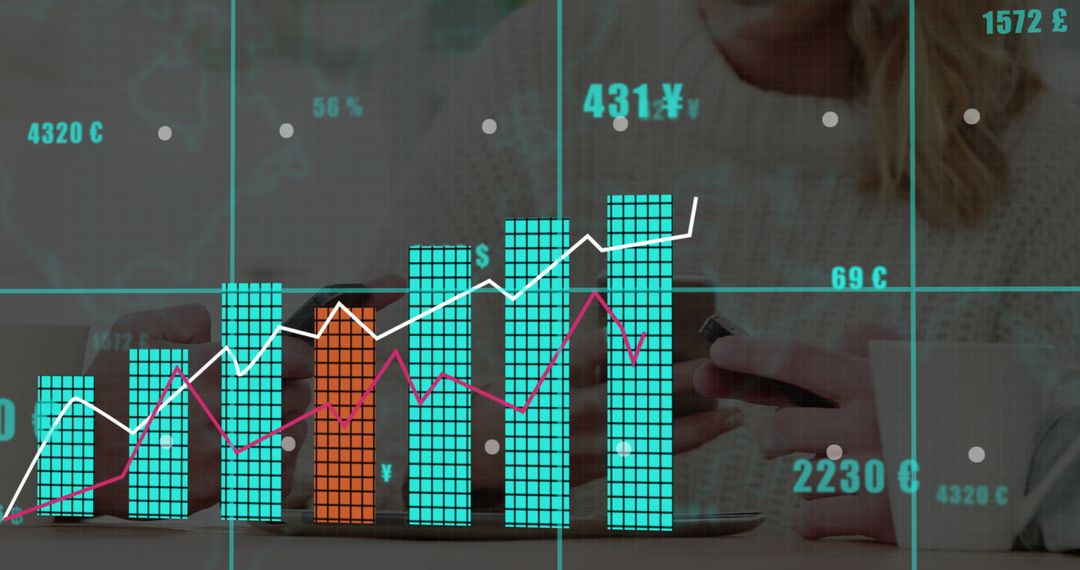
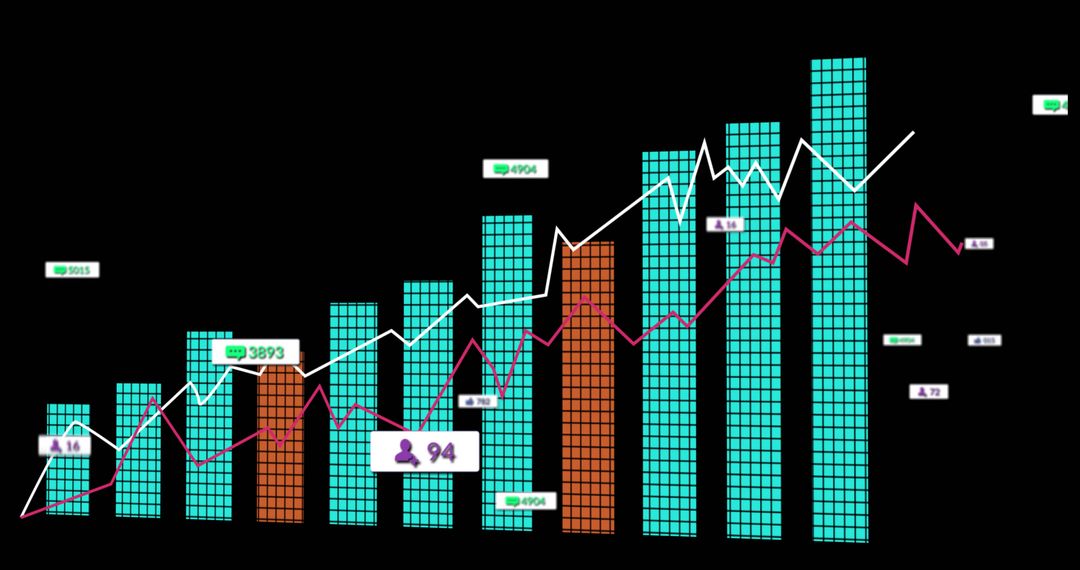
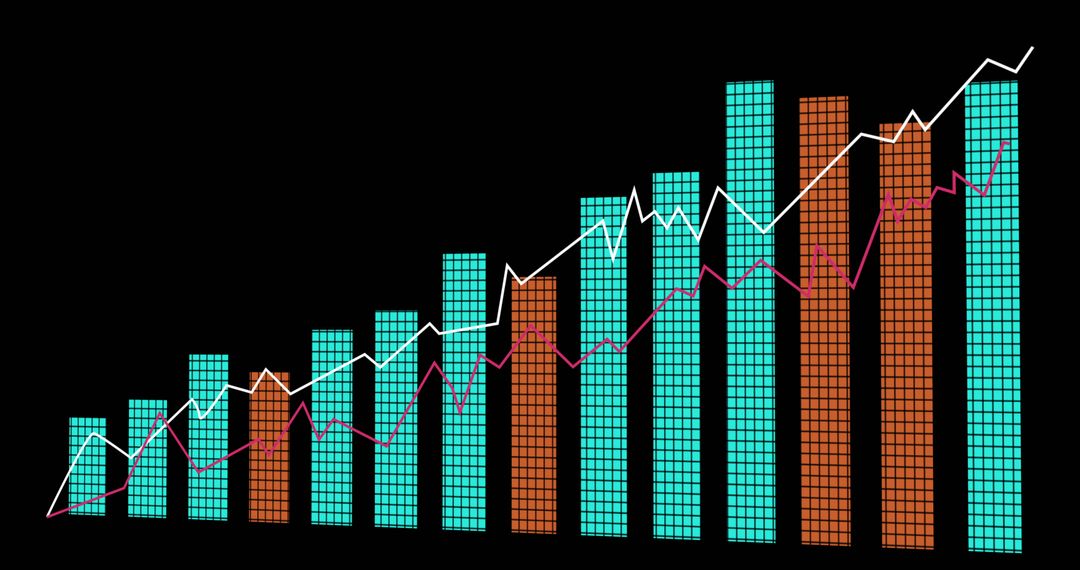
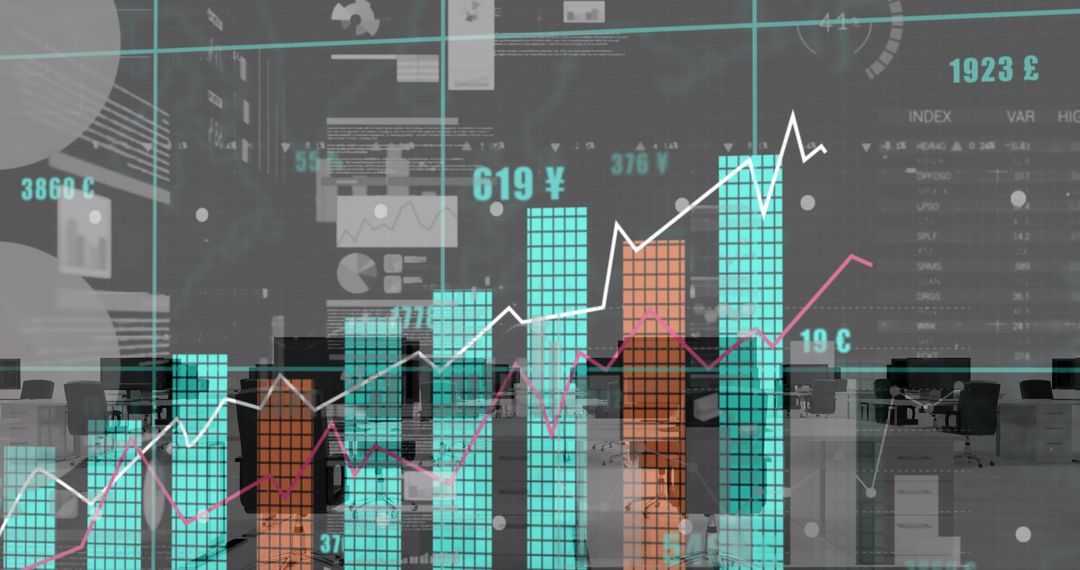
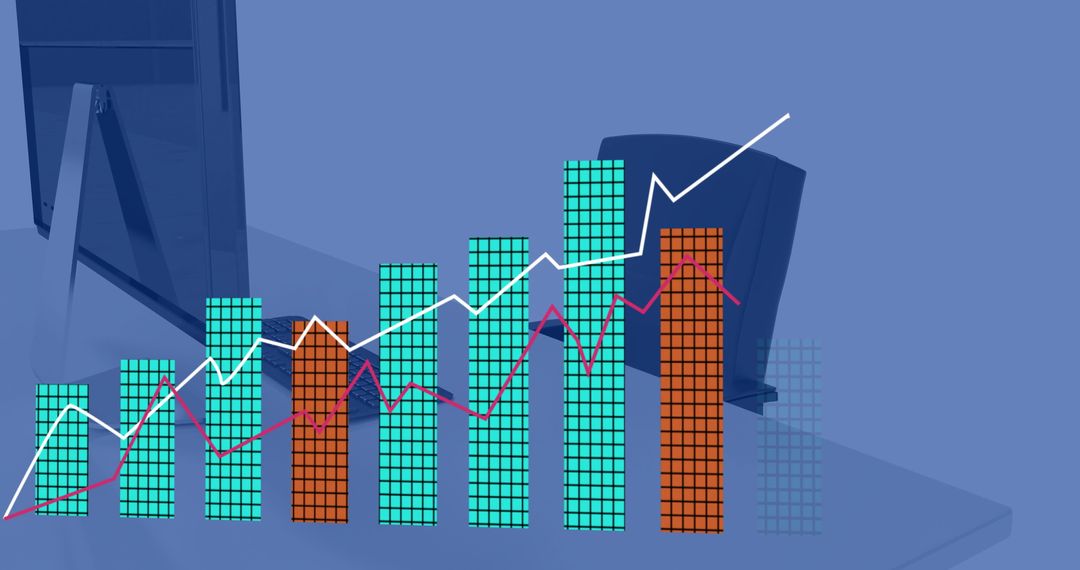
- Futuristic Data Dashboard with Bar Charts and Trend Lines
Futuristic Data Dashboard with Bar Charts and Trend Lines Image
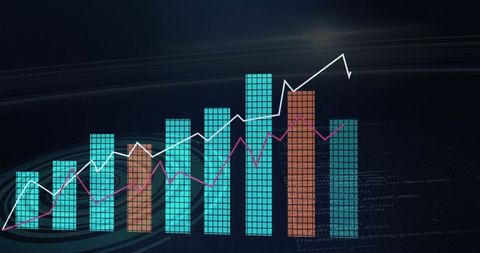
Elegant futuristic data dashboard displaying bar charts with turquoise and brown color bars alongside white and magenta trend lines. Ideal for presentations related to data-driven insights, analytical tools, and financial statistics. Perfect for digital technology content, illustrating modern analytics or enhancing material around futurist themes.
Powered by 


0
downloads
downloads
Tags:
More
Credit Photo
If you would like to credit the Photo, here are some ways you can do so
Text Link
photo Link
<span class="text-link">
<span>
<a target="_blank" href=https://pikwizard.com/photo/futuristic-data-dashboard-with-bar-charts-and-trend-lines/c83735822eb7ccf9f3d43f5daaa5c53d/>PikWizard</a>
</span>
</span>
<span class="image-link">
<span
style="margin: 0 0 20px 0; display: inline-block; vertical-align: middle; width: 100%;"
>
<a
target="_blank"
href="https://pikwizard.com/photo/futuristic-data-dashboard-with-bar-charts-and-trend-lines/c83735822eb7ccf9f3d43f5daaa5c53d/"
style="text-decoration: none; font-size: 10px; margin: 0;"
>
<img src="https://pikwizard.com/pw/medium/c83735822eb7ccf9f3d43f5daaa5c53d.jpg" style="margin: 0; width: 100%;" alt="" />
<p style="font-size: 12px; margin: 0;">PikWizard</p>
</a>
</span>
</span>
Free (free of charge)
Free for personal and commercial use.
Author: Authentic Images
Similar Free Stock Images
Premium


Premium


Premium


Premium

Premium


Premium


Premium


Premium


Premium


Premium


Premium


Premium


Premium


Premium


Premium


Premium


Premium


Premium


Premium


Premium


Premium


Premium


Premium


Premium