- Home >
- Stock Photos >
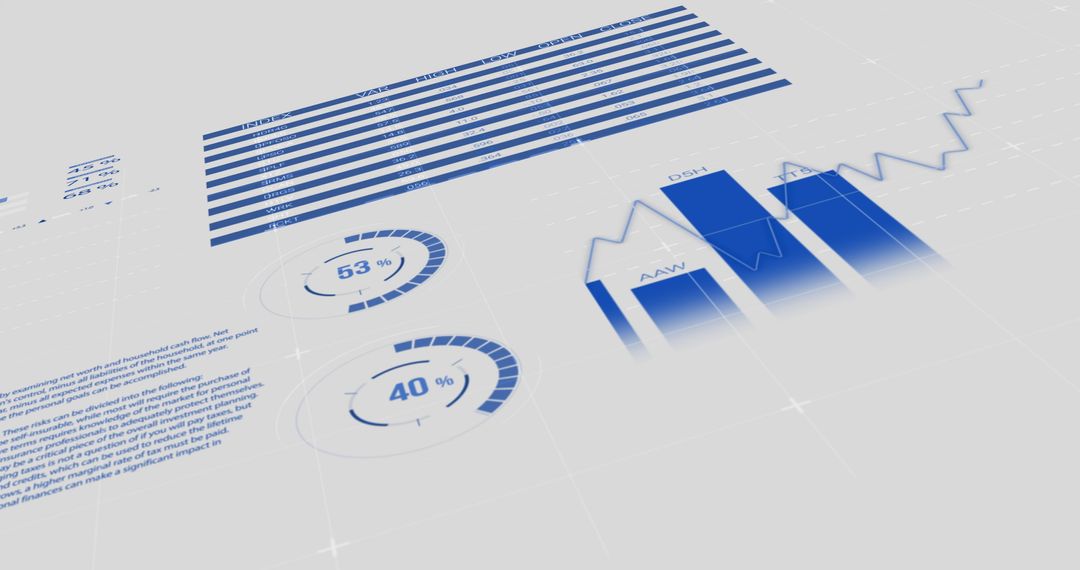
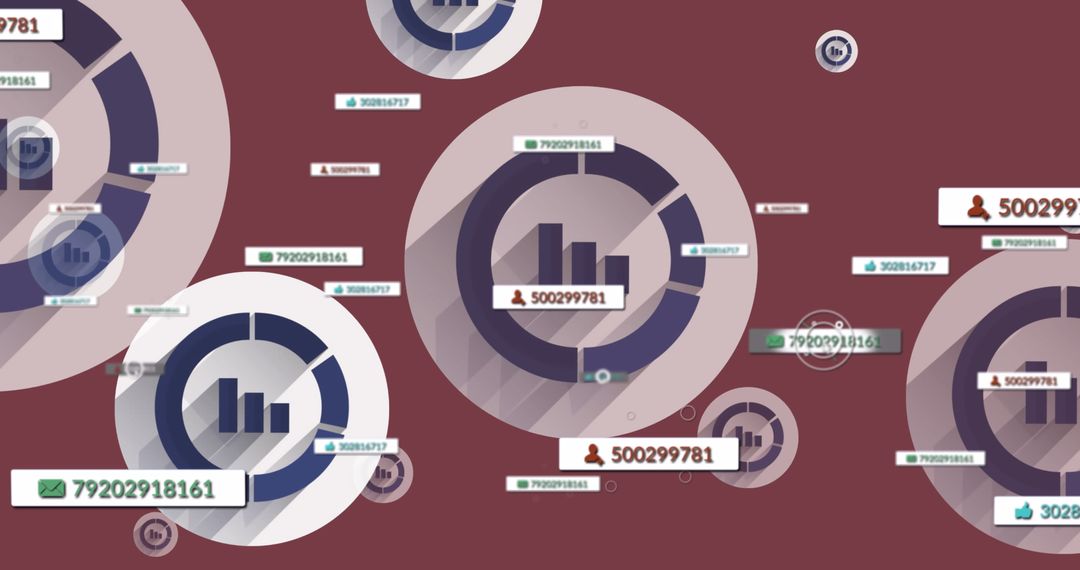
- Futuristic Data Visualization with Digital Statistics on Purple Grid
Futuristic Data Visualization with Digital Statistics on Purple Grid Image

This futuristic theme focuses on data visualization with statistics presented over a purple grid background. Ideal for use in posters, presentations, or media related to business analytics, technological innovation, and data processing. Perfect for conveying ideas about complex data solutions and tech trends.
Powered by  - Get 15% off with code: PIKWIZARD15


2
downloads
downloads
Tags:
More
Credit Photo
If you would like to credit the Photo, here are some ways you can do so
Text Link
photo Link
<span class="text-link">
<span>
<a target="_blank" href=https://pikwizard.com/photo/futuristic-data-visualization-with-digital-statistics-on-purple-grid/36297c543893748f32e29cfe06e25469/>PikWizard</a>
</span>
</span>
<span class="image-link">
<span
style="margin: 0 0 20px 0; display: inline-block; vertical-align: middle; width: 100%;"
>
<a
target="_blank"
href="https://pikwizard.com/photo/futuristic-data-visualization-with-digital-statistics-on-purple-grid/36297c543893748f32e29cfe06e25469/"
style="text-decoration: none; font-size: 10px; margin: 0;"
>
<img src="https://pikwizard.com/pw/medium/36297c543893748f32e29cfe06e25469.jpg" style="margin: 0; width: 100%;" alt="" />
<p style="font-size: 12px; margin: 0;">PikWizard</p>
</a>
</span>
</span>
Free (free of charge)
Free for personal and commercial use.
Author: People Creations
Similar Free Stock Images

Premium


Premium


Premium


Premium


Premium


Premium


Premium


Premium


Premium


Premium


Premium


Premium


Premium


Premium


Premium


Premium


Premium


Premium


Premium


Premium


Premium


Premium


Premium


Premium