- Home >
- Stock Photos >
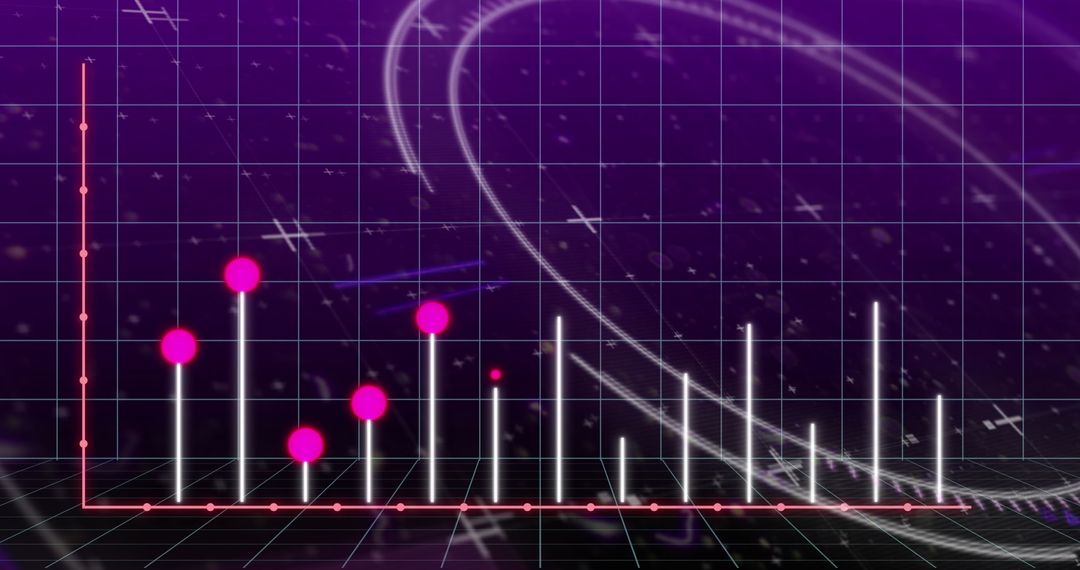
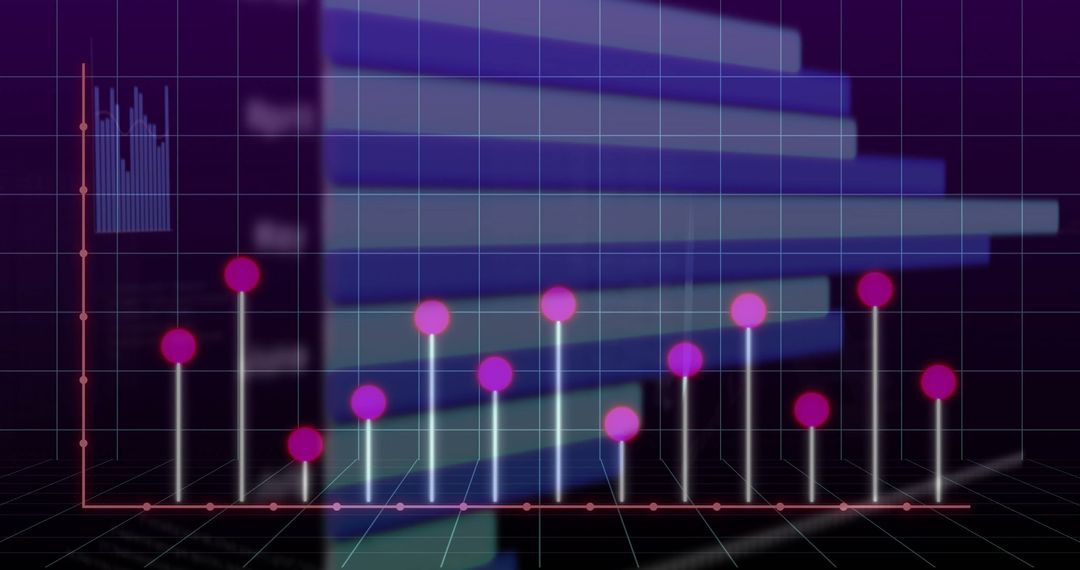
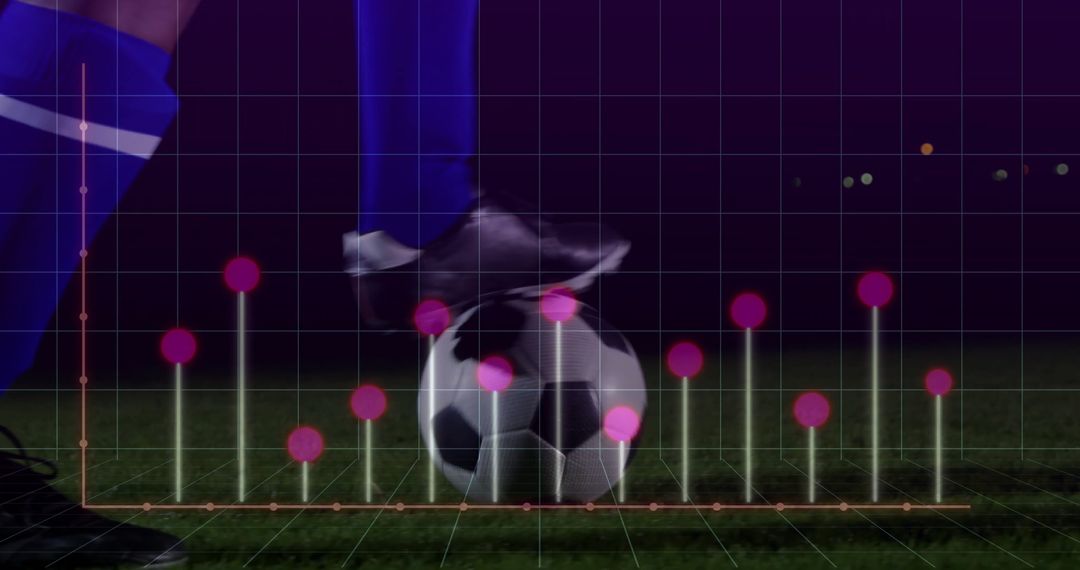
- Futuristic Data Visualization with Glowing Pink Spheres
Futuristic Data Visualization with Glowing Pink Spheres Image

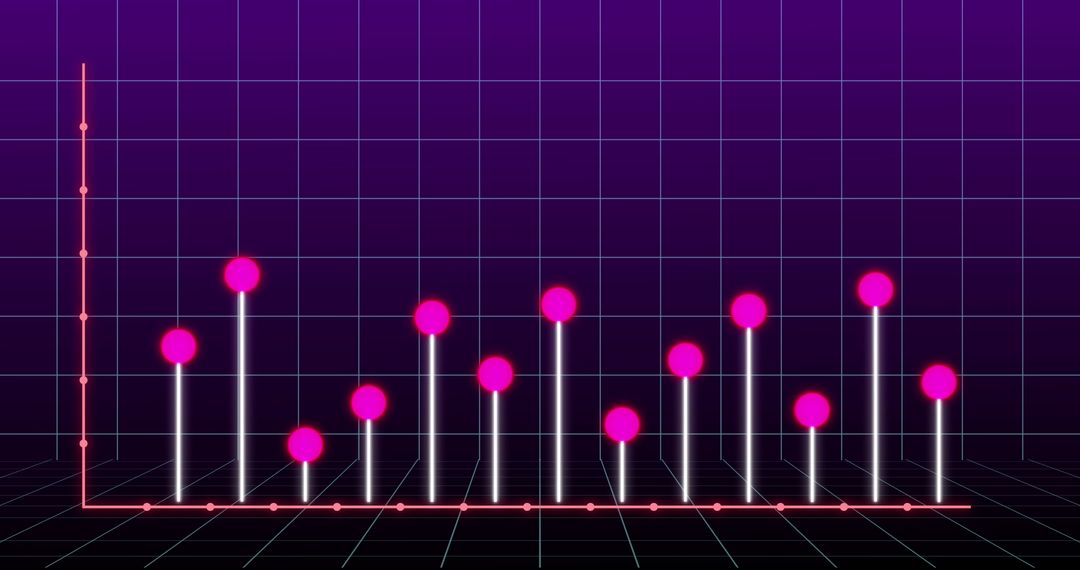
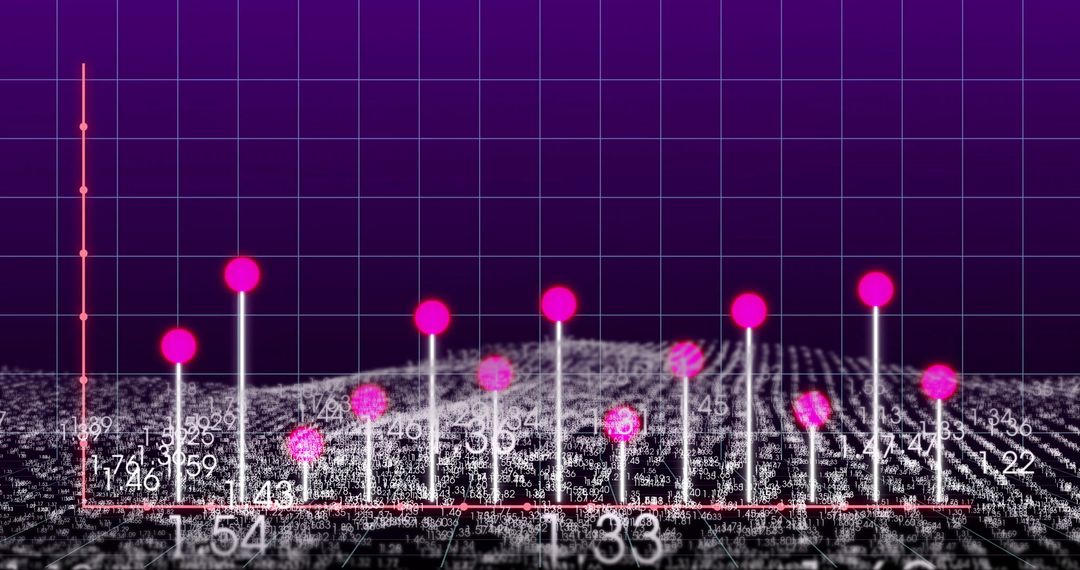
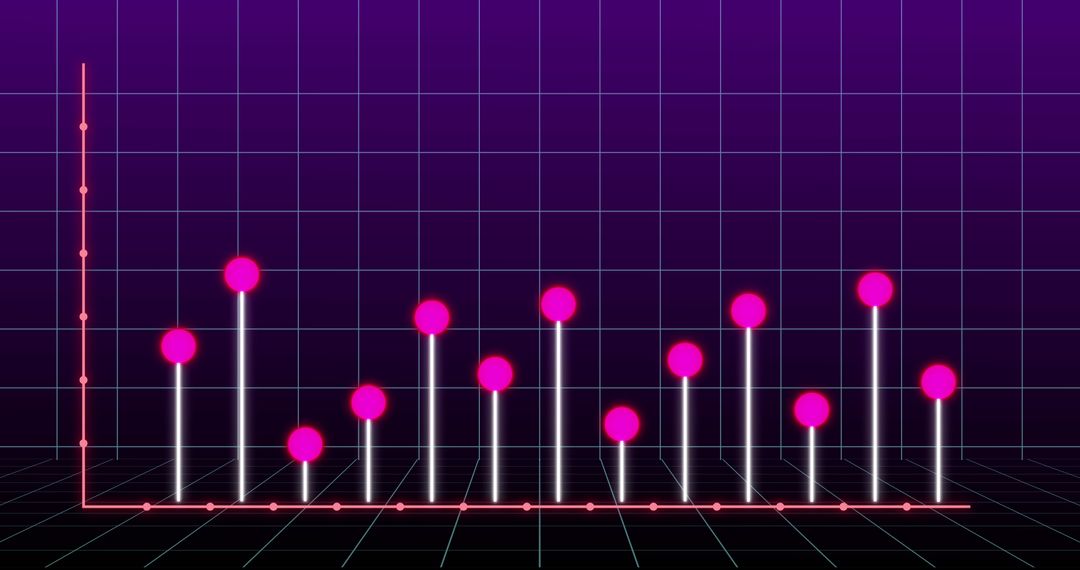
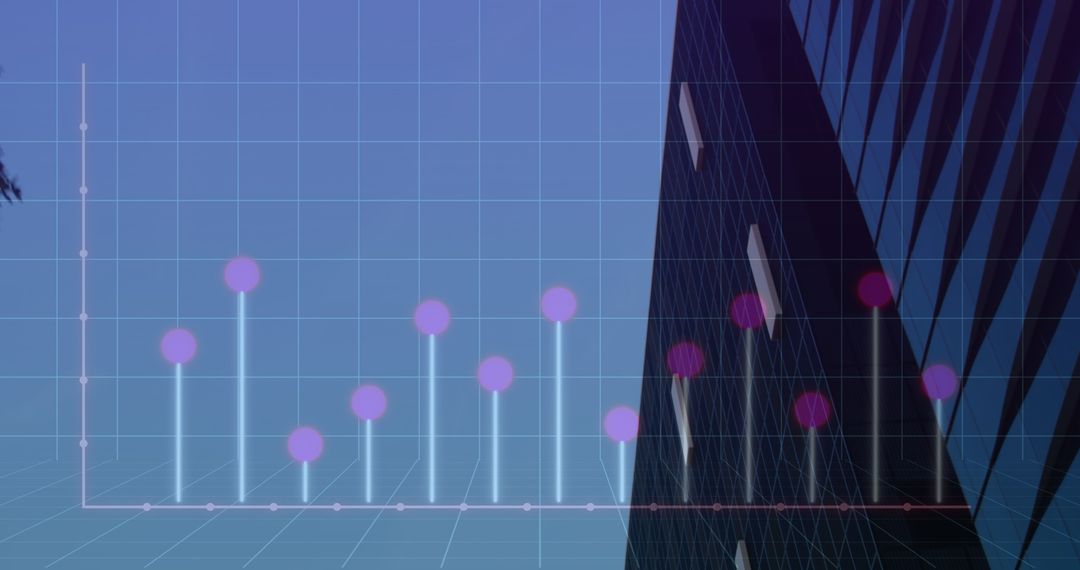
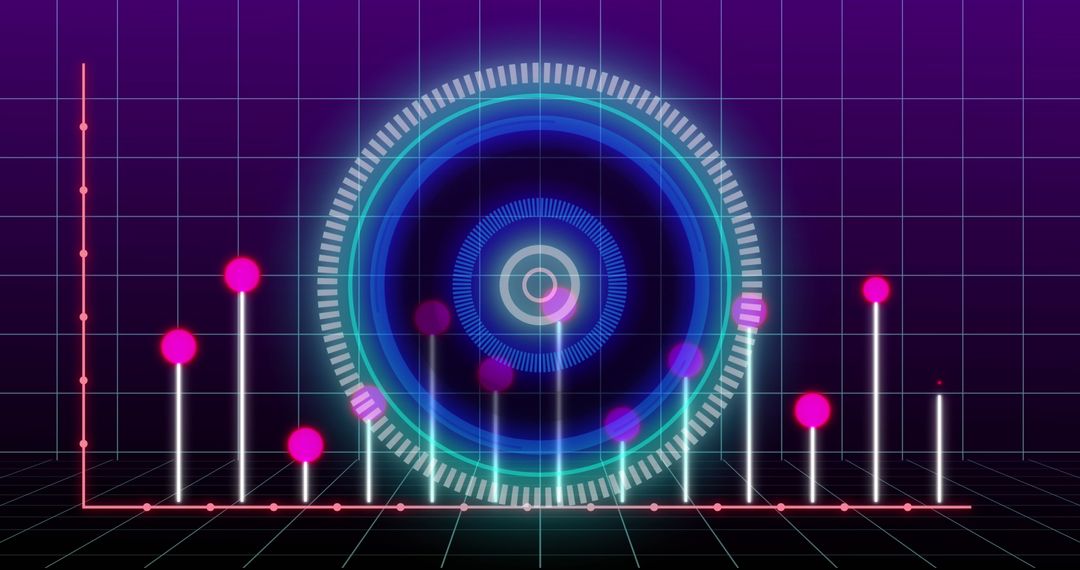
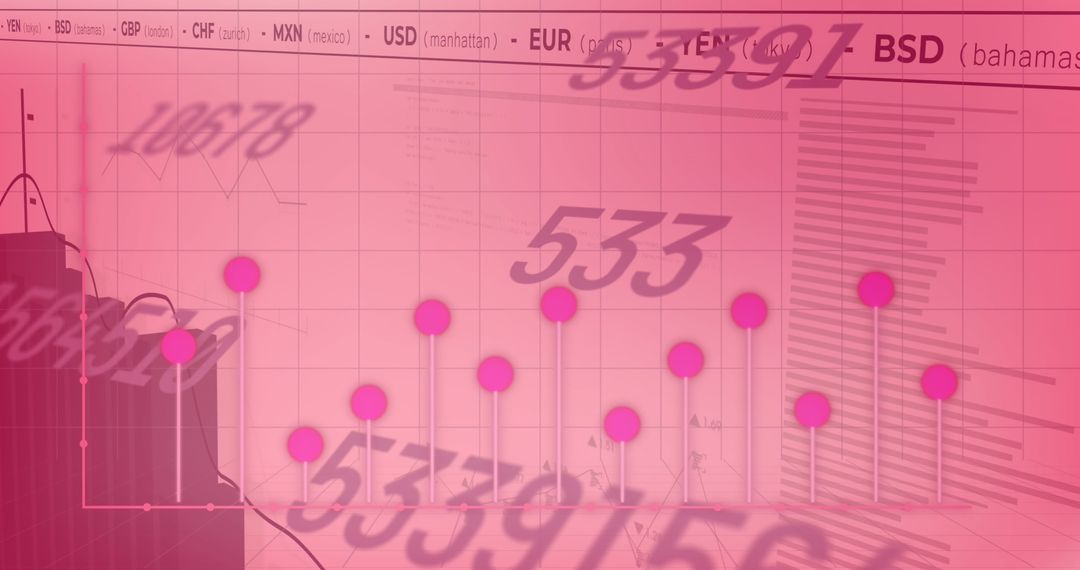
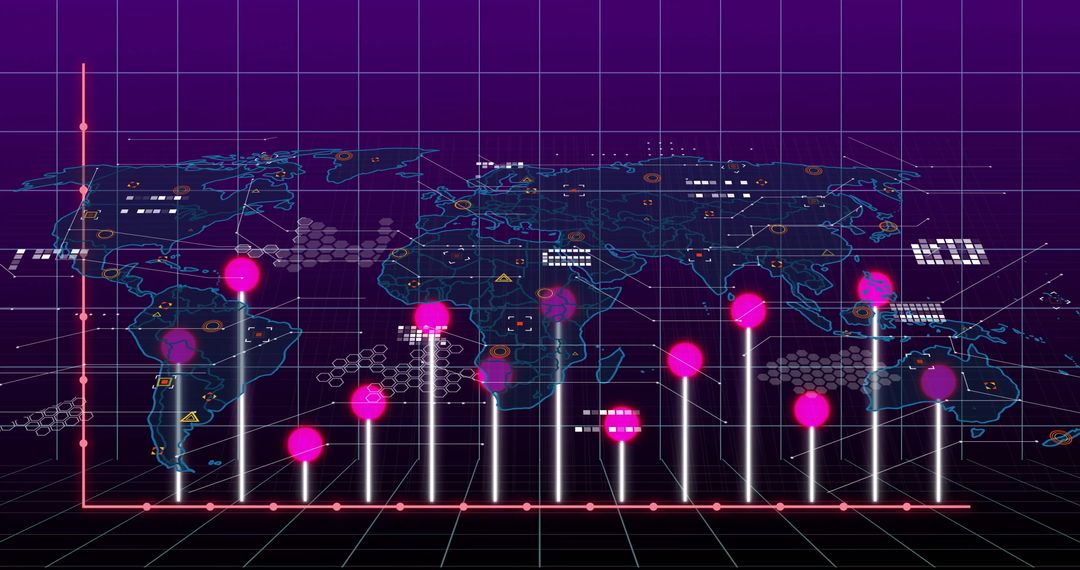
Abstract visualization features glowing pink spheres atop rising bars and a black grid pattern. Futuristic background includes circuit motifs highlighting themes of technology and innovation. Used in digital marketing, tech presentations, data analytics. Perfect for modern aesthetic conveying progress and advanced insights.
Powered by  - Get 15% off with code: PIKWIZARD15


0
downloads
downloads
Tags:
More
Credit Photo
If you would like to credit the Photo, here are some ways you can do so
Text Link
photo Link
<span class="text-link">
<span>
<a target="_blank" href=https://pikwizard.com/photo/futuristic-data-visualization-with-glowing-pink-spheres/9d8b0e3162323663971e458d4ac5a895/>PikWizard</a>
</span>
</span>
<span class="image-link">
<span
style="margin: 0 0 20px 0; display: inline-block; vertical-align: middle; width: 100%;"
>
<a
target="_blank"
href="https://pikwizard.com/photo/futuristic-data-visualization-with-glowing-pink-spheres/9d8b0e3162323663971e458d4ac5a895/"
style="text-decoration: none; font-size: 10px; margin: 0;"
>
<img src="https://pikwizard.com/pw/medium/9d8b0e3162323663971e458d4ac5a895.jpg" style="margin: 0; width: 100%;" alt="" />
<p style="font-size: 12px; margin: 0;">PikWizard</p>
</a>
</span>
</span>
Free (free of charge)
Free for personal and commercial use.
Author: Authentic Images
Similar Free Stock Images

Premium


Premium


Premium


Premium


Premium


Premium


Premium


Premium


Premium


Premium


Premium


Premium


Premium


Premium


Premium


Premium


Premium


Premium


Premium


Premium


Premium


Premium


Premium


Premium