- Home >
- Stock Photos >
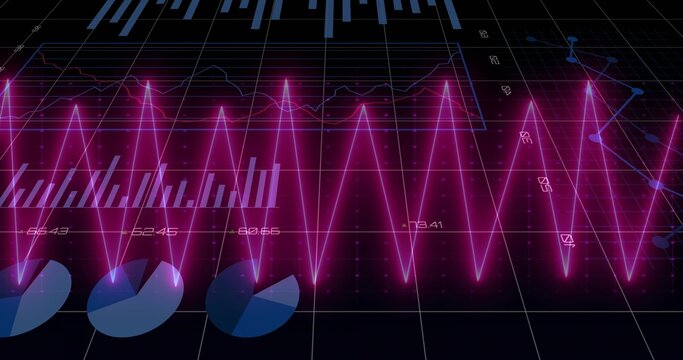
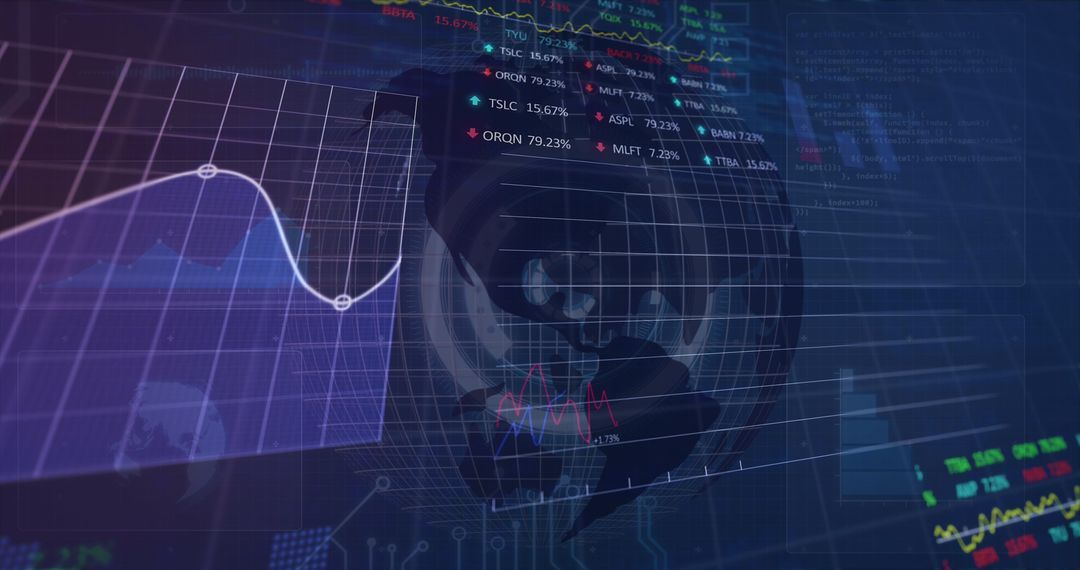
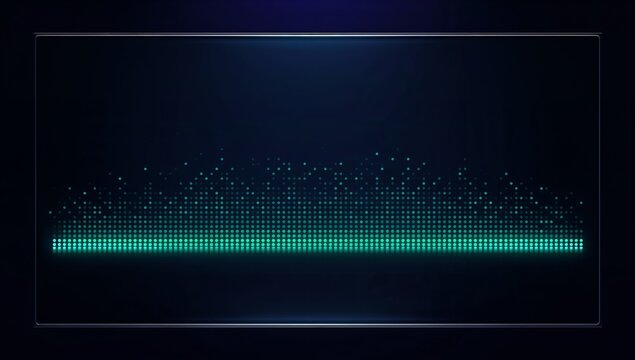
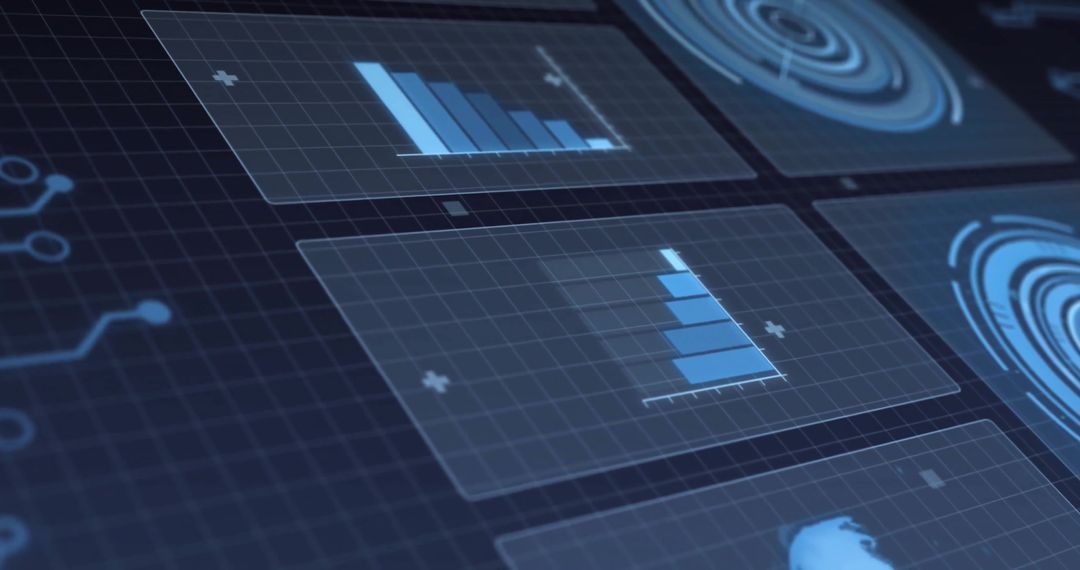
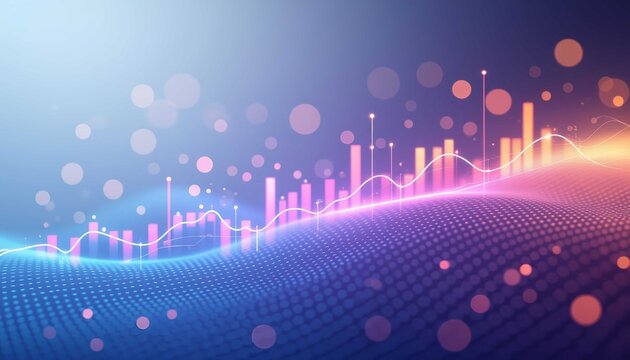
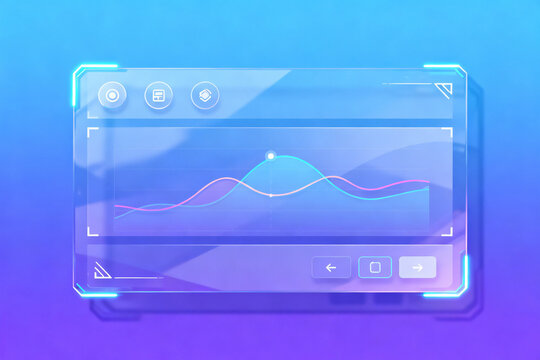
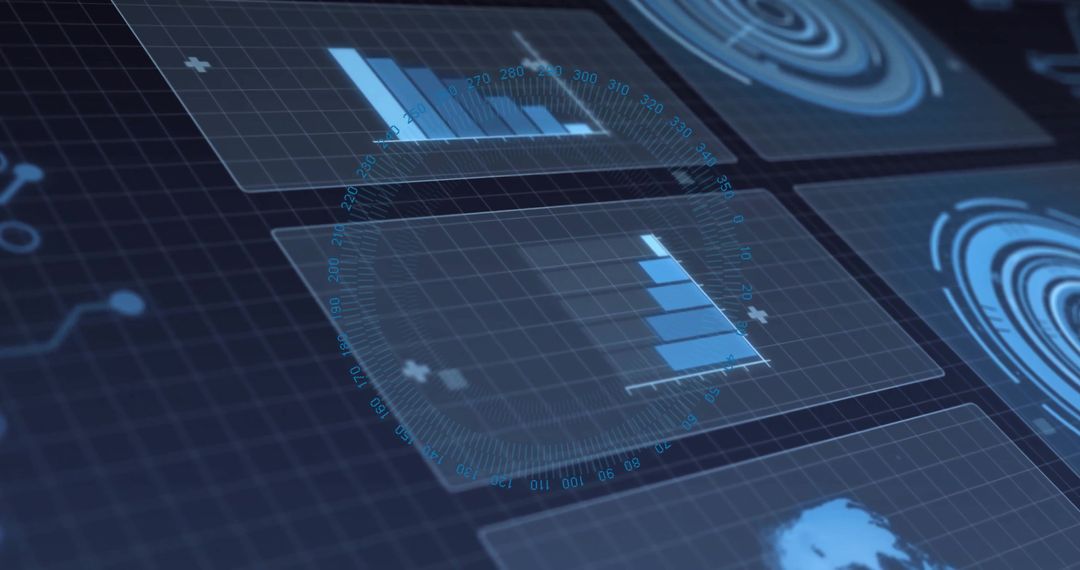
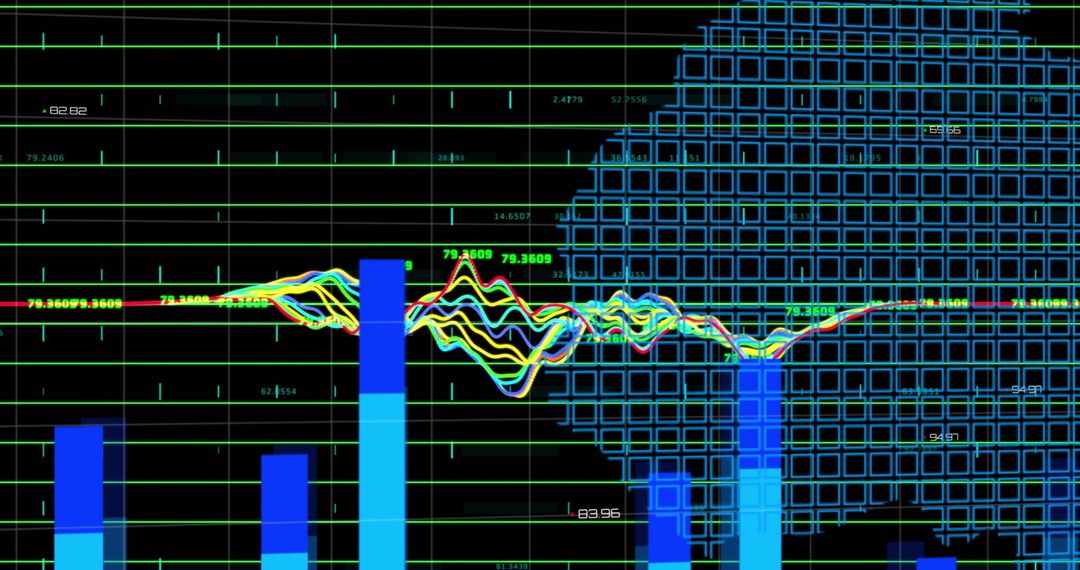
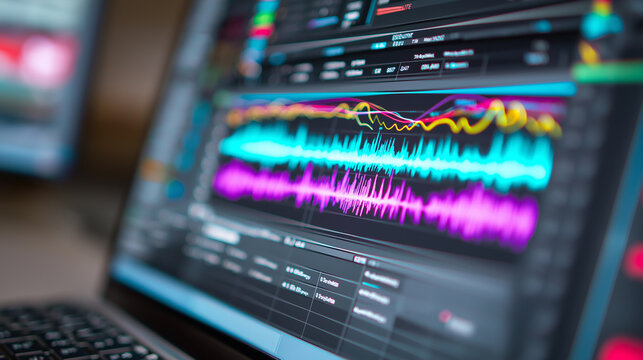
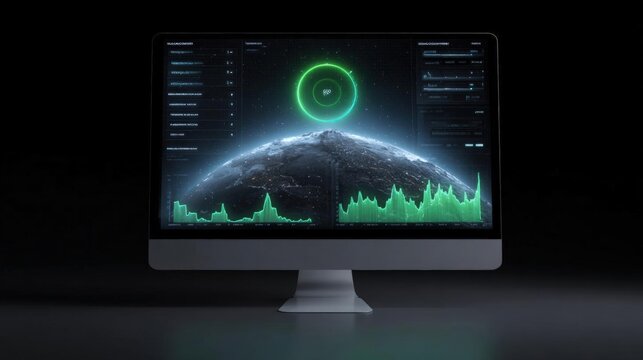
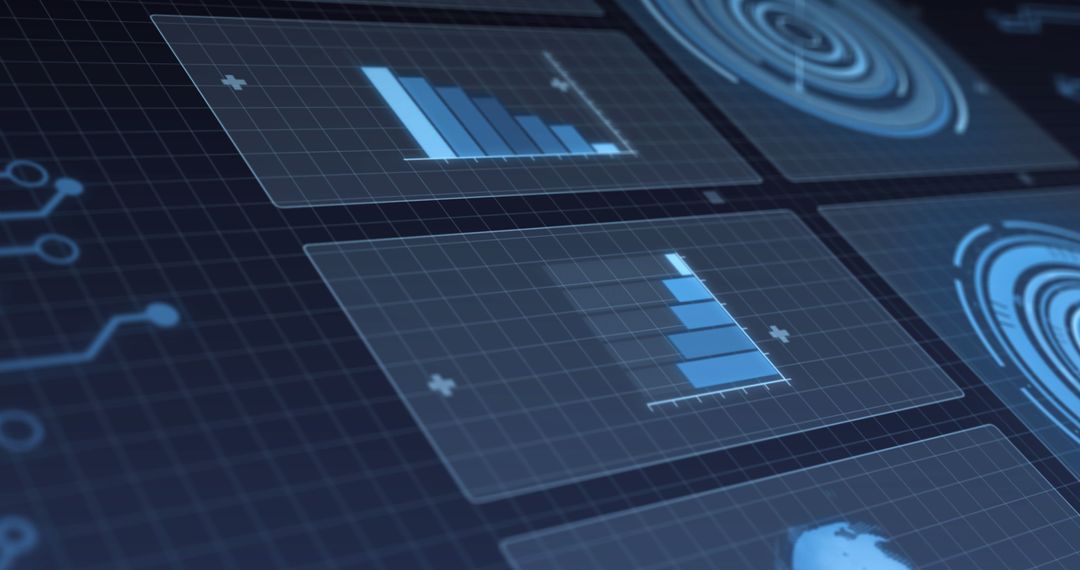
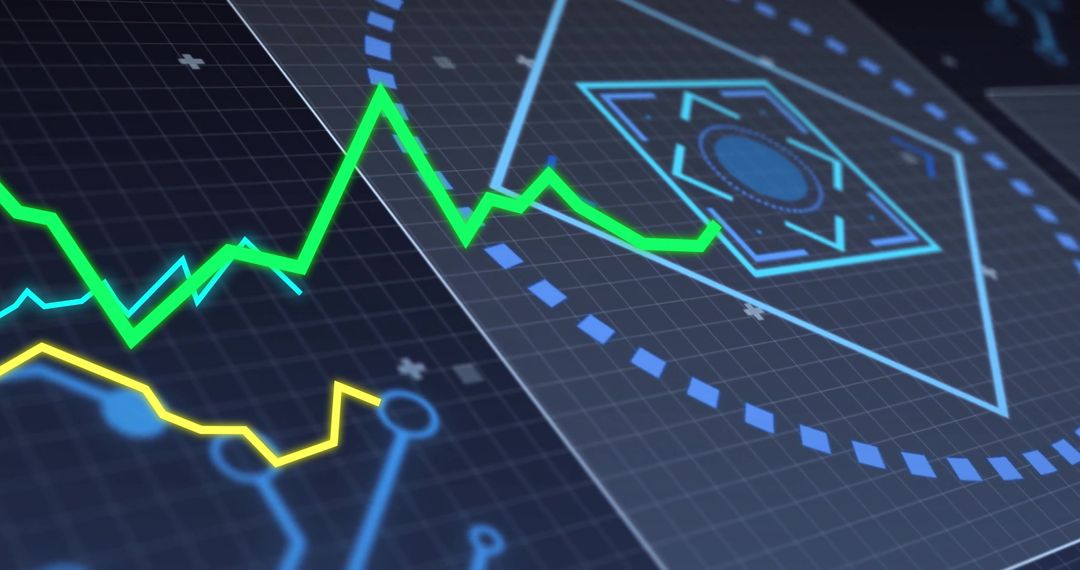
- Futuristic Digital Dashboard Featuring Green Waveform and Blue Bar Charts
Futuristic Digital Dashboard Featuring Green Waveform and Blue Bar Charts Image
This visualization depicts a futuristic digital dashboard featuring semi-transparent panels. A dynamic green waveform stretches across the display, combined with multiple blue bar charts, signifying innovative data analytics. Suitable for use in presentations, promotional content focusing on technological innovation, educational materials, and articles on future tech or data management.
Powered by 


0
downloads
downloads
Tags:
More
Credit Photo
If you would like to credit the Photo, here are some ways you can do so
Text Link
photo Link
<span class="text-link">
<span>
<a target="_blank" href=https://pikwizard.com/photo/futuristic-digital-dashboard-featuring-green-waveform-and-blue-bar-charts/c0b423aa696e574a6cd36829fa3c6dea/>PikWizard</a>
</span>
</span>
<span class="image-link">
<span
style="margin: 0 0 20px 0; display: inline-block; vertical-align: middle; width: 100%;"
>
<a
target="_blank"
href="https://pikwizard.com/photo/futuristic-digital-dashboard-featuring-green-waveform-and-blue-bar-charts/c0b423aa696e574a6cd36829fa3c6dea/"
style="text-decoration: none; font-size: 10px; margin: 0;"
>
<img src="https://pikwizard.com/pw/medium/c0b423aa696e574a6cd36829fa3c6dea.jpg" style="margin: 0; width: 100%;" alt="" />
<p style="font-size: 12px; margin: 0;">PikWizard</p>
</a>
</span>
</span>
Free (free of charge)
Free for personal and commercial use.
Author: Awesome Content
Similar Free Stock Images

Premium


Premium


Premium


Premium


Premium


Premium


Premium


Premium


Premium


Premium


Premium


Premium


Premium


Premium


Premium


Premium


Premium


Premium


Premium


Premium


Premium


Premium


Premium


Premium