
- Home >
- Stock Photos >
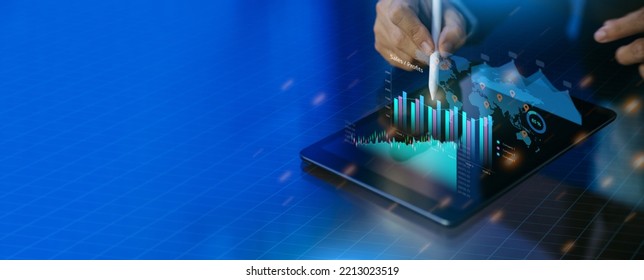
- Futuristic Digital Finance Dashboard with Charts and Tickers
Futuristic Digital Finance Dashboard with Charts and Tickers Image

This image presents a detailed digital finance dashboard featuring ticker symbols, line charts, and neon grid patterns, showcasing advanced graphical elements and technological themes. Ideal for use in projects related to financial analysis, technology investment, stock market trading, and futuristic data dashboard designs, this visualization is suitable for businesses and individuals focusing on modern finance apps, fintech products, and trading interfaces.
Powered by  - Get 15% off with code: PIKWIZARD15


2
downloads
downloads
Tags:
More
Credit Photo
If you would like to credit the Photo, here are some ways you can do so
Text Link
photo Link
<span class="text-link">
<span>
<a target="_blank" href=https://pikwizard.com/photo/futuristic-digital-finance-dashboard-with-charts-and-tickers/80c570cdeab811415ec824efaeaf8735/>PikWizard</a>
</span>
</span>
<span class="image-link">
<span
style="margin: 0 0 20px 0; display: inline-block; vertical-align: middle; width: 100%;"
>
<a
target="_blank"
href="https://pikwizard.com/photo/futuristic-digital-finance-dashboard-with-charts-and-tickers/80c570cdeab811415ec824efaeaf8735/"
style="text-decoration: none; font-size: 10px; margin: 0;"
>
<img src="https://pikwizard.com/pw/medium/80c570cdeab811415ec824efaeaf8735.jpg" style="margin: 0; width: 100%;" alt="" />
<p style="font-size: 12px; margin: 0;">PikWizard</p>
</a>
</span>
</span>
Free (free of charge)
Free for personal and commercial use.
Author: Awesome Content
Similar Free Stock Images

Premium


Premium


Premium


Premium


Premium


Premium


Premium


Premium


Premium


Premium


Premium


Premium


Premium


Premium


Premium


Premium


Premium


Premium


Premium


Premium


Premium


Premium


Premium


Premium


Premium

