- Home >
- Stock Photos >
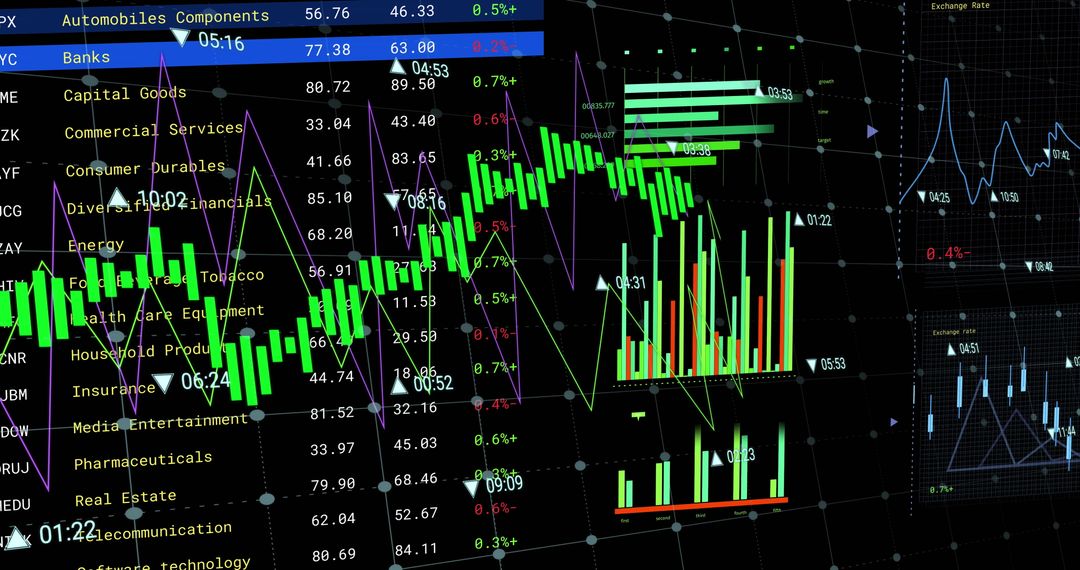
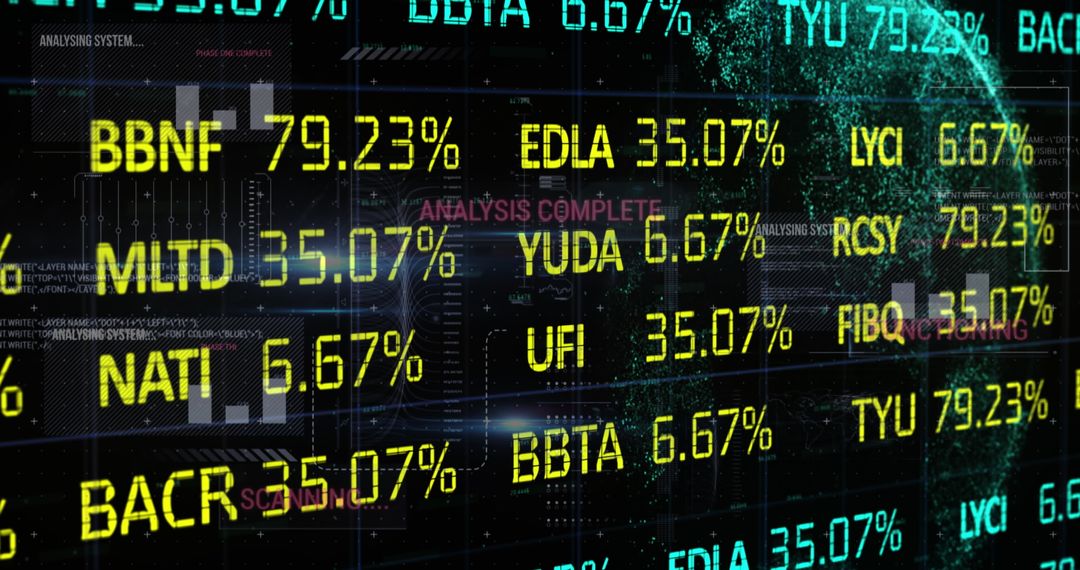
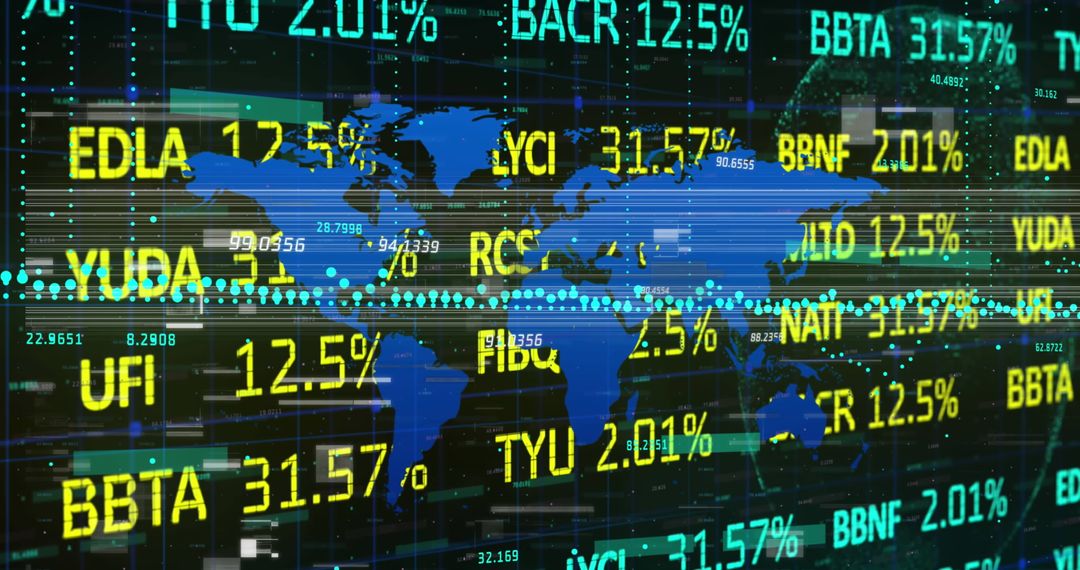
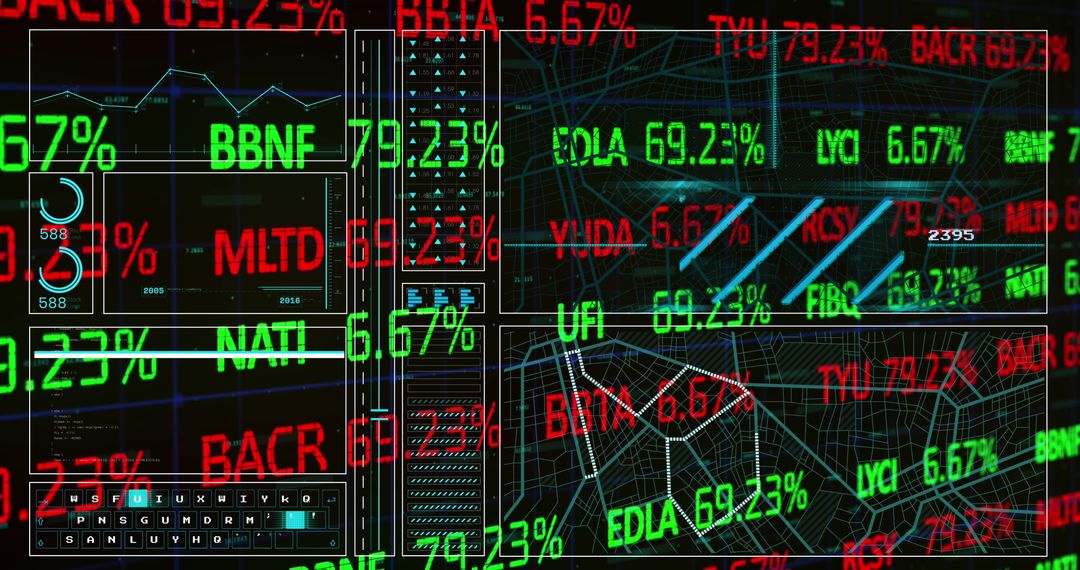
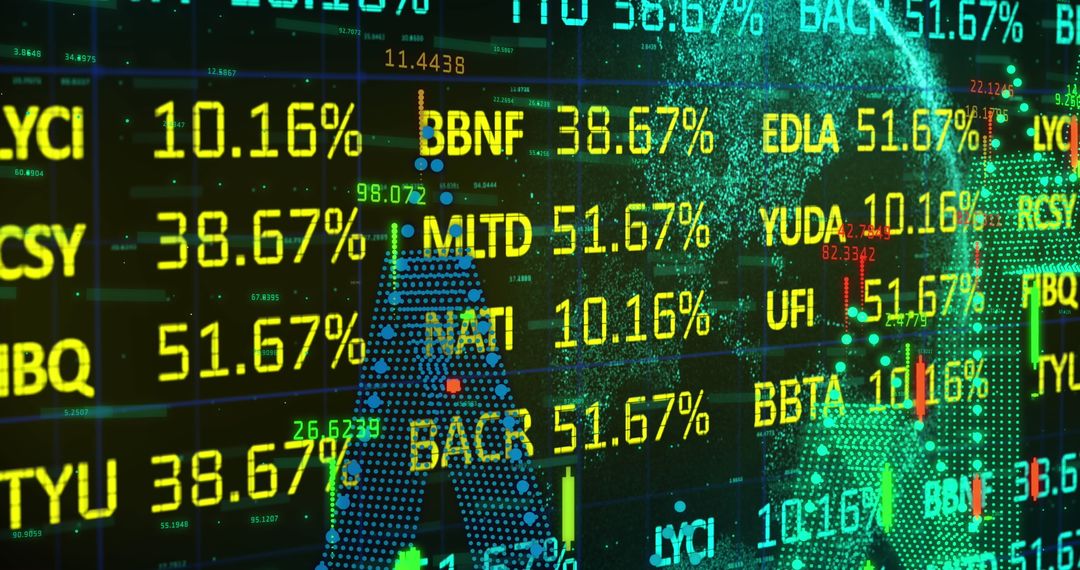
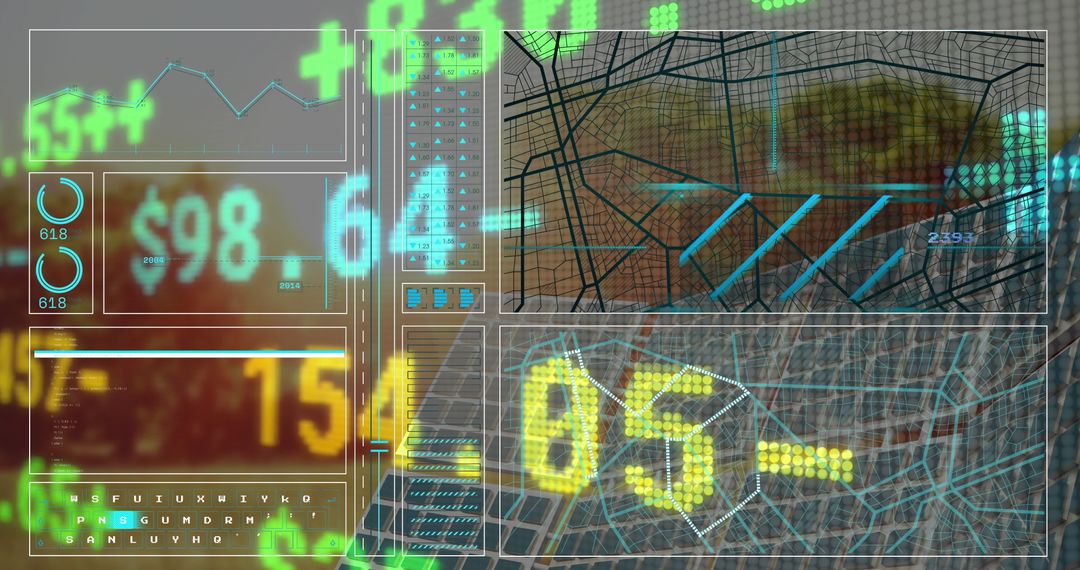
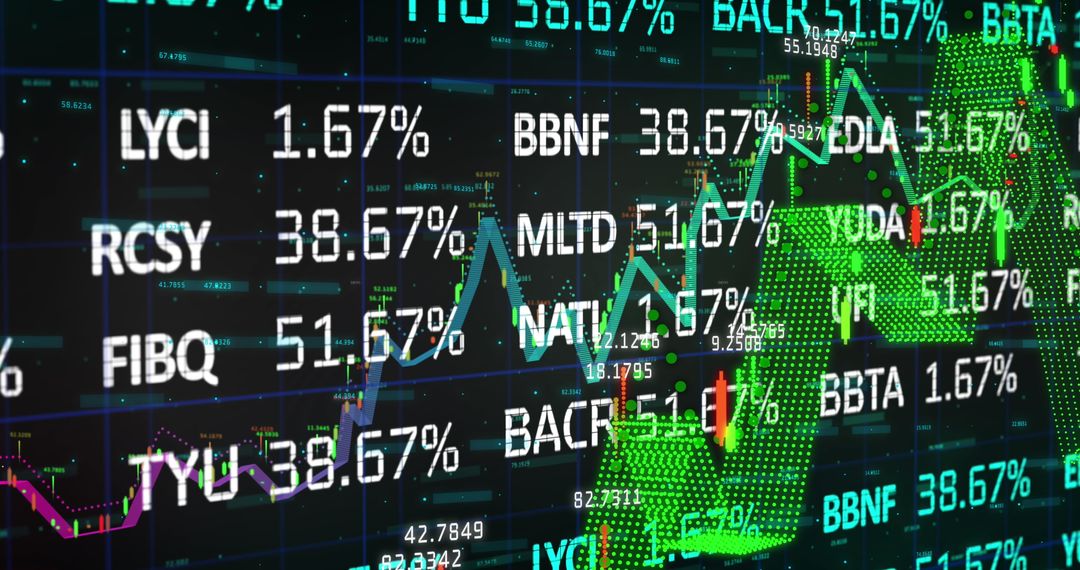
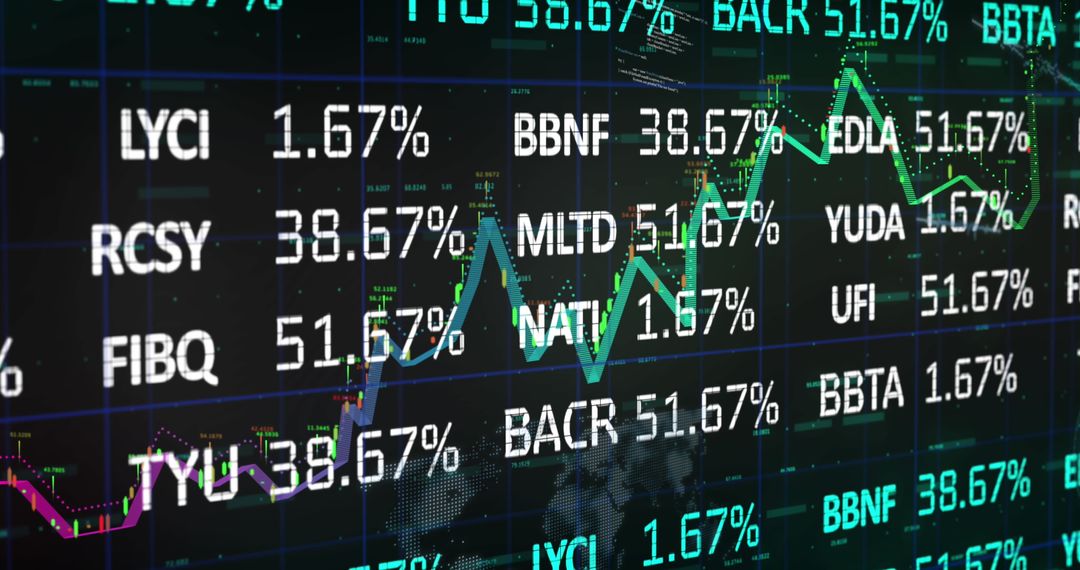
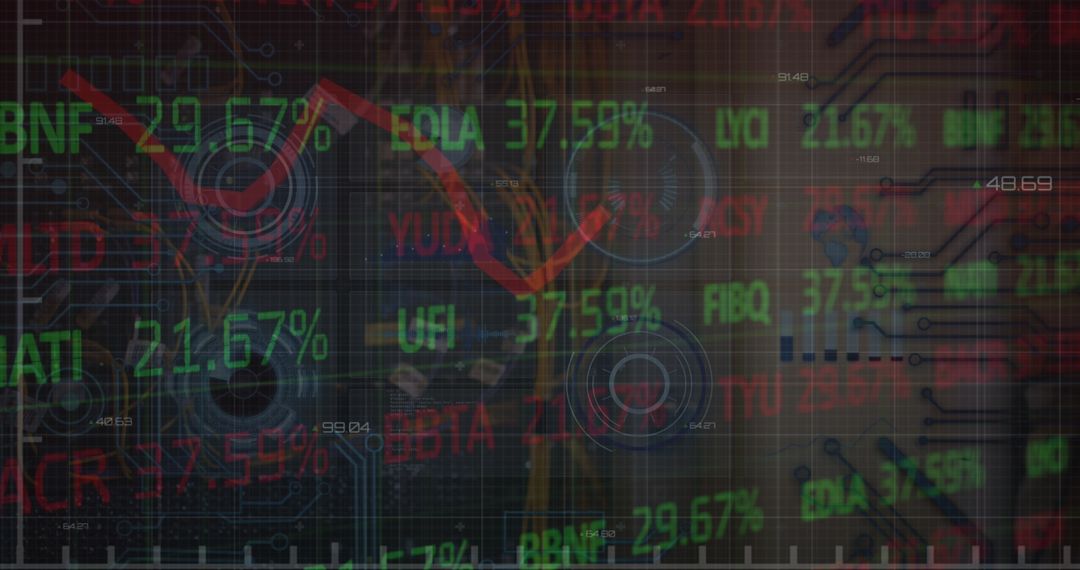
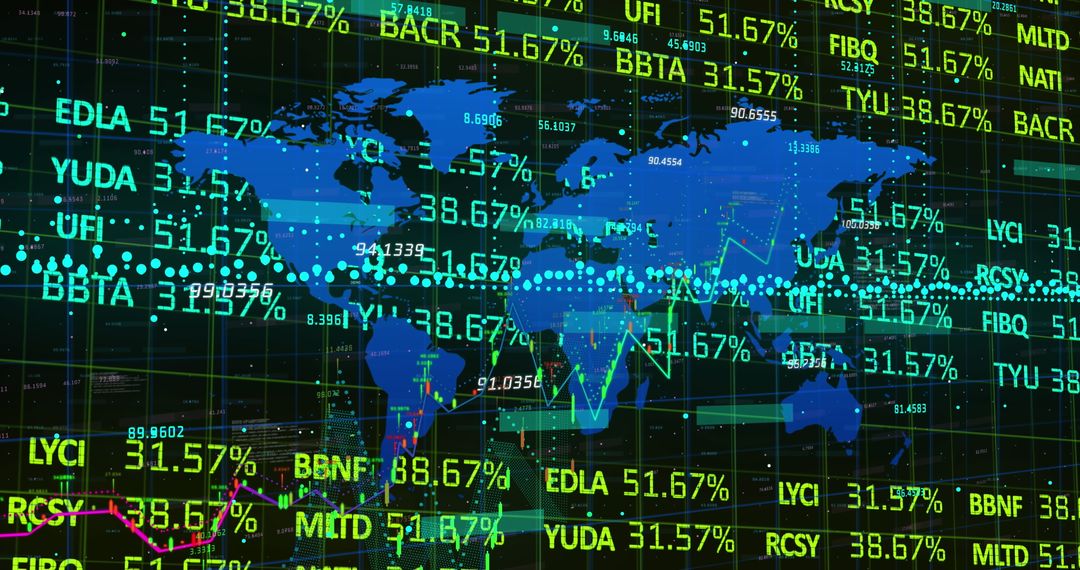
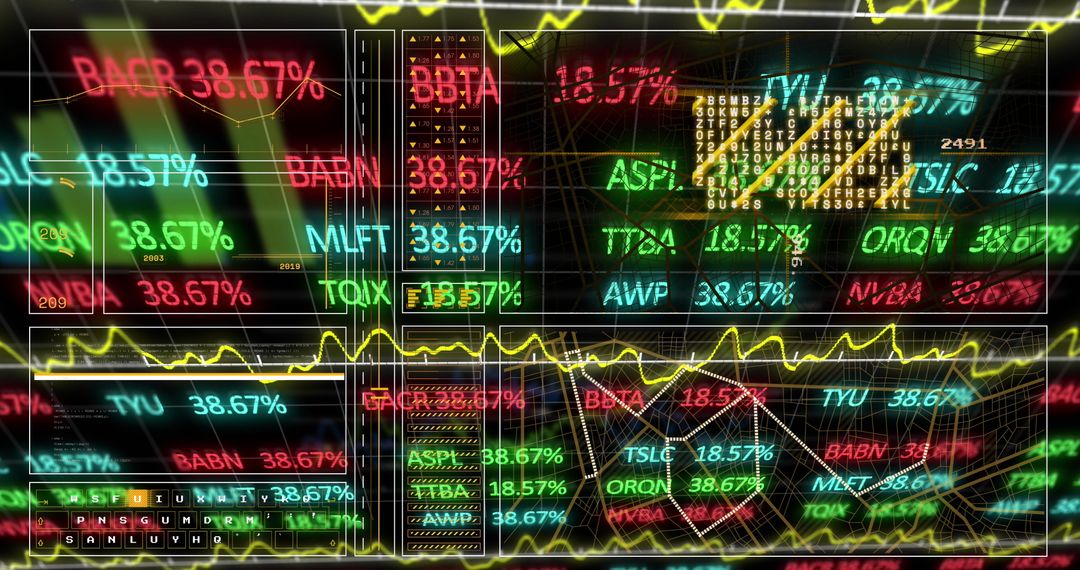
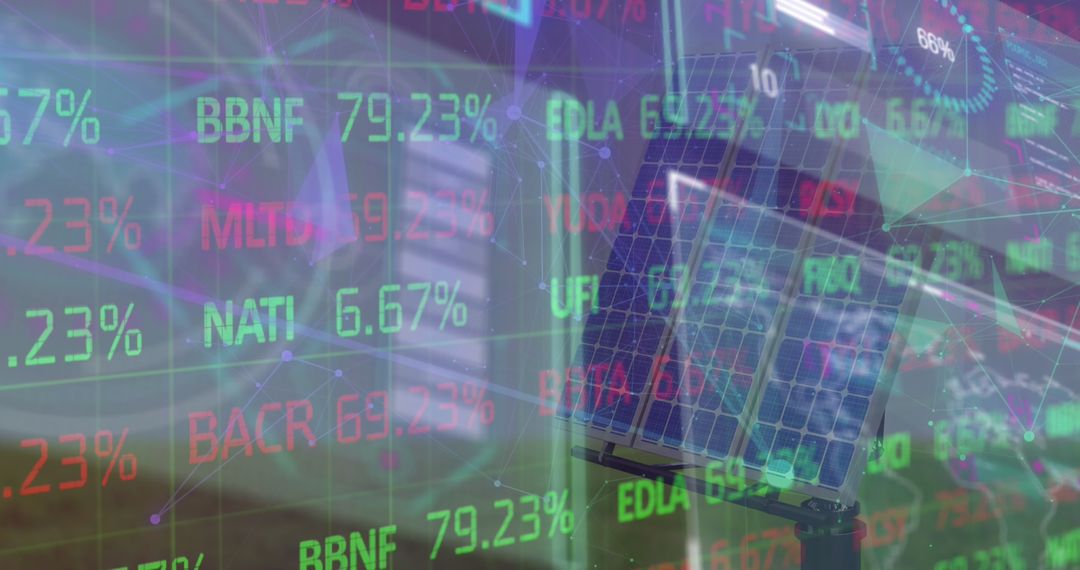
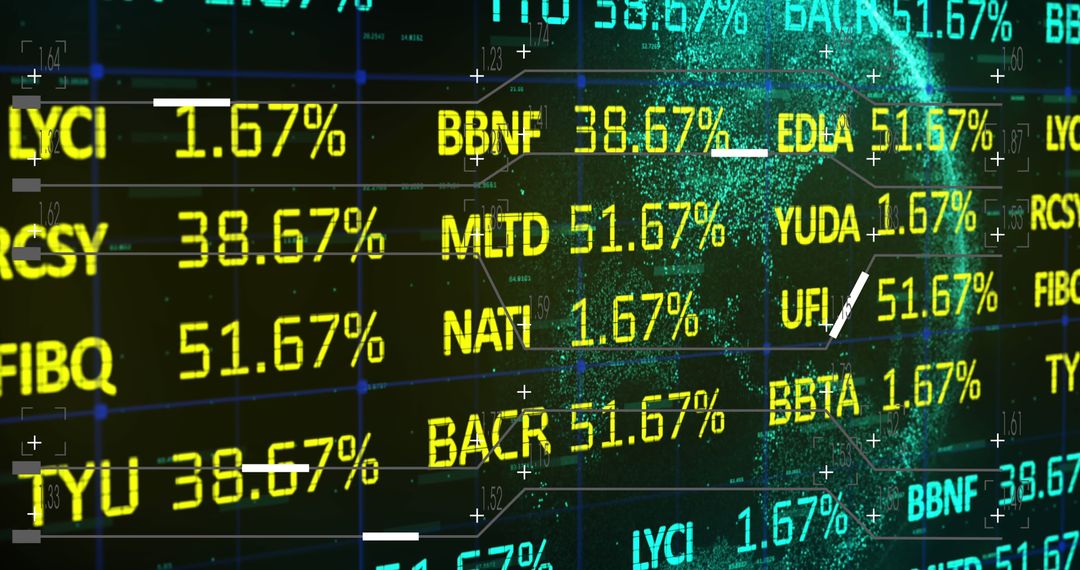
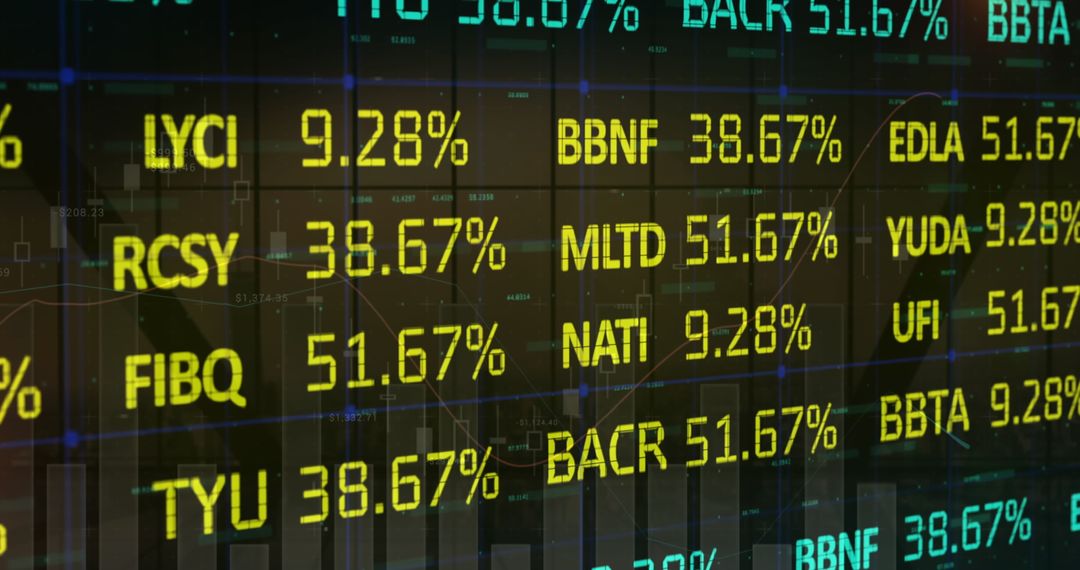
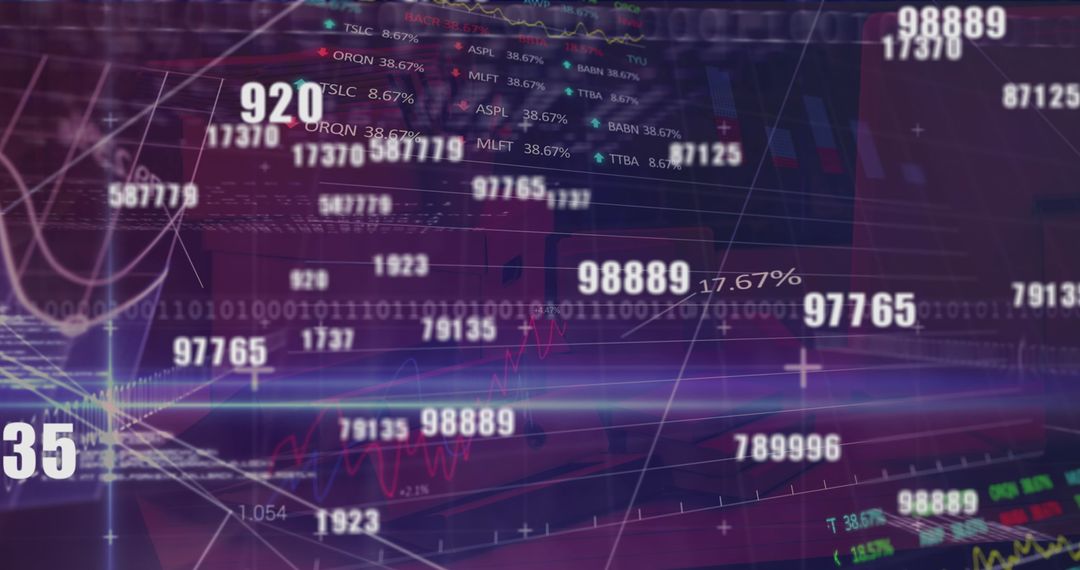
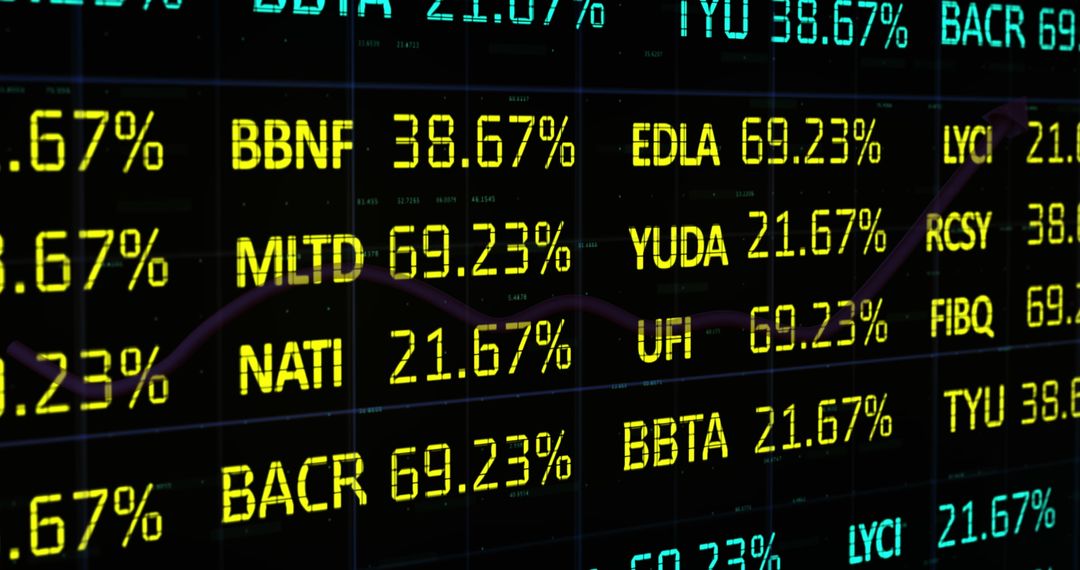
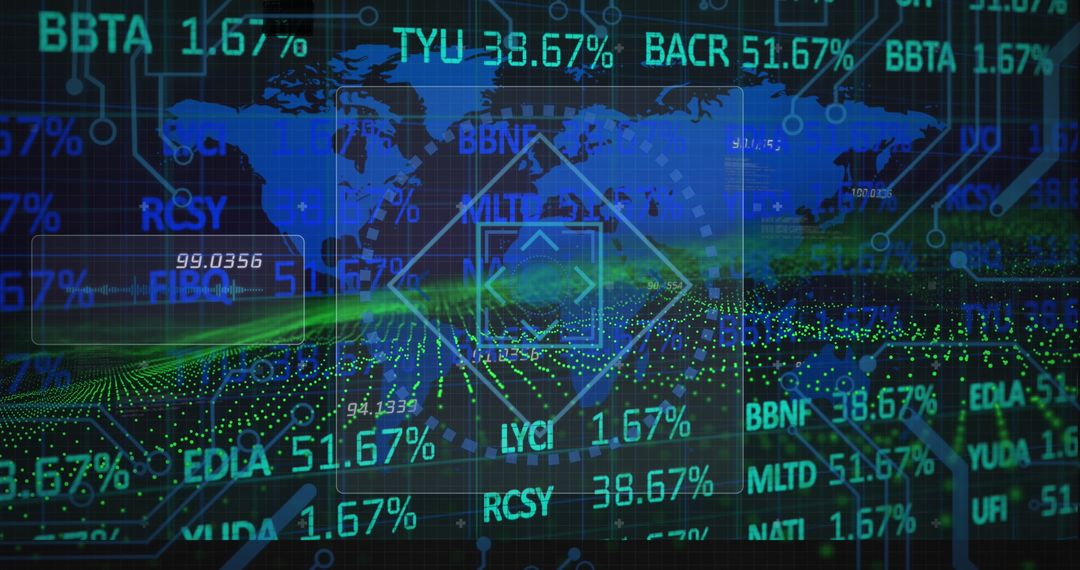
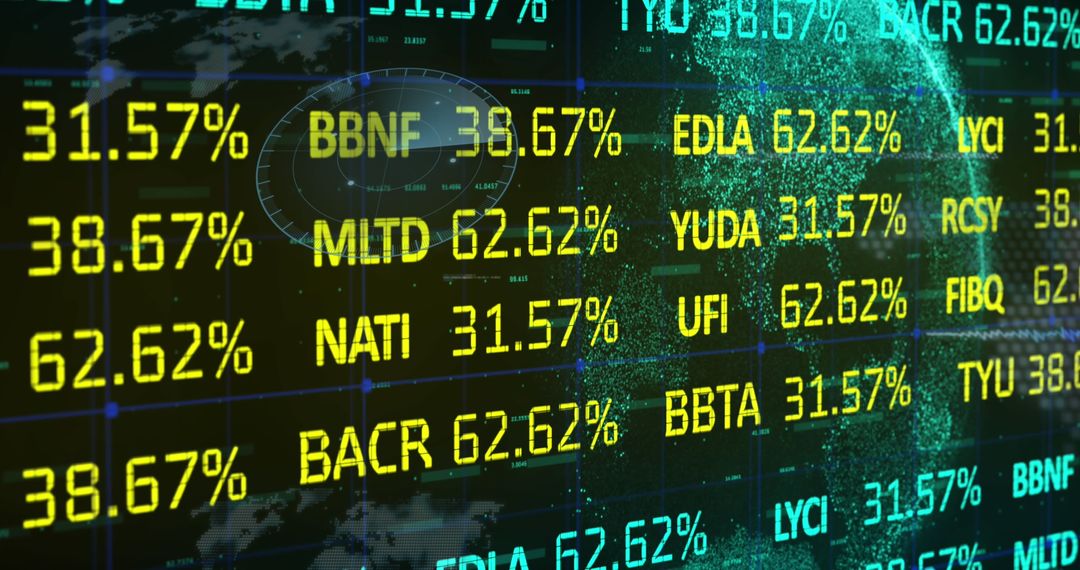
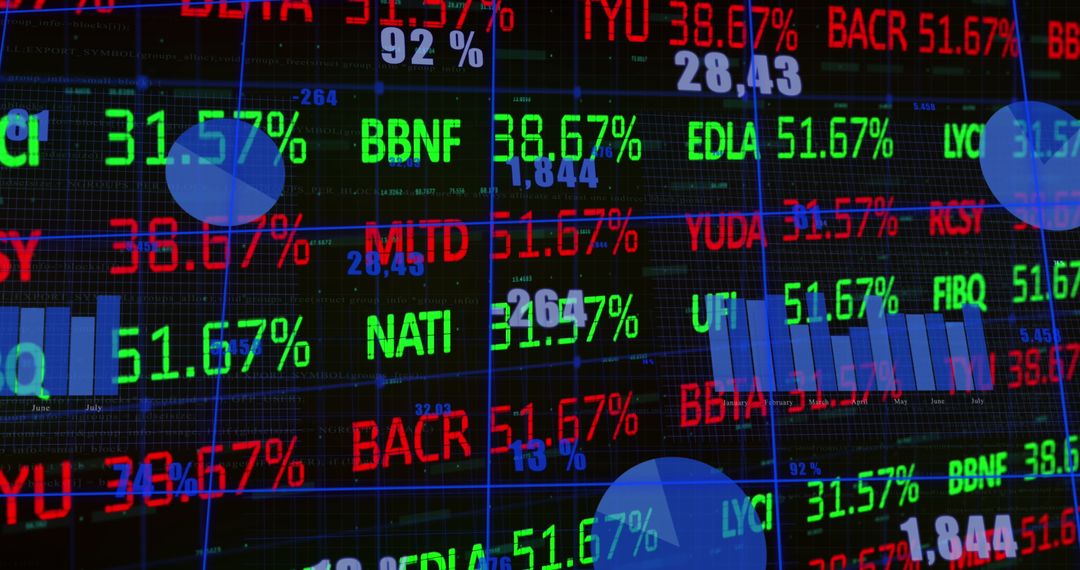
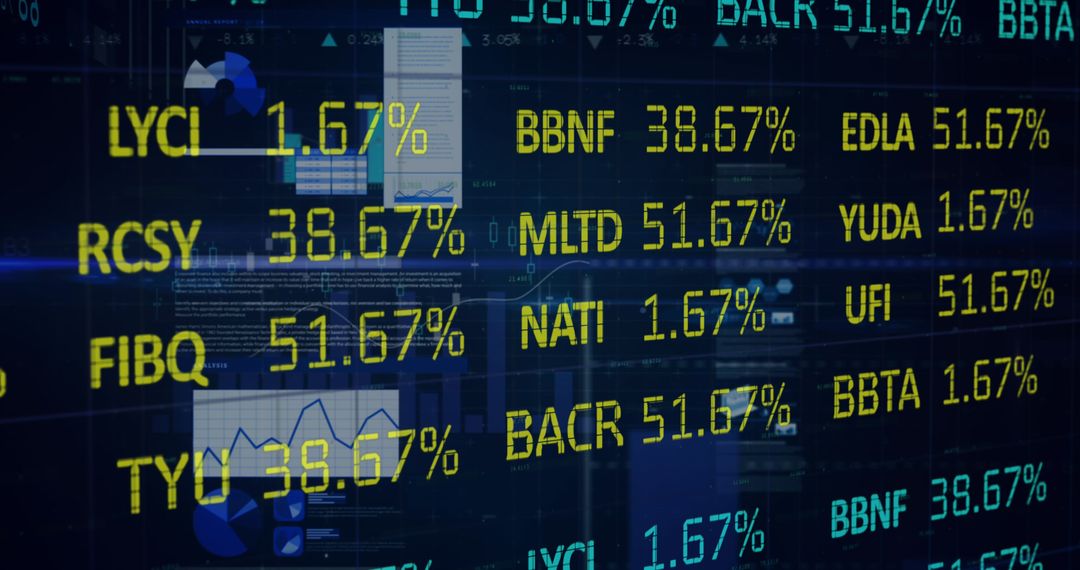
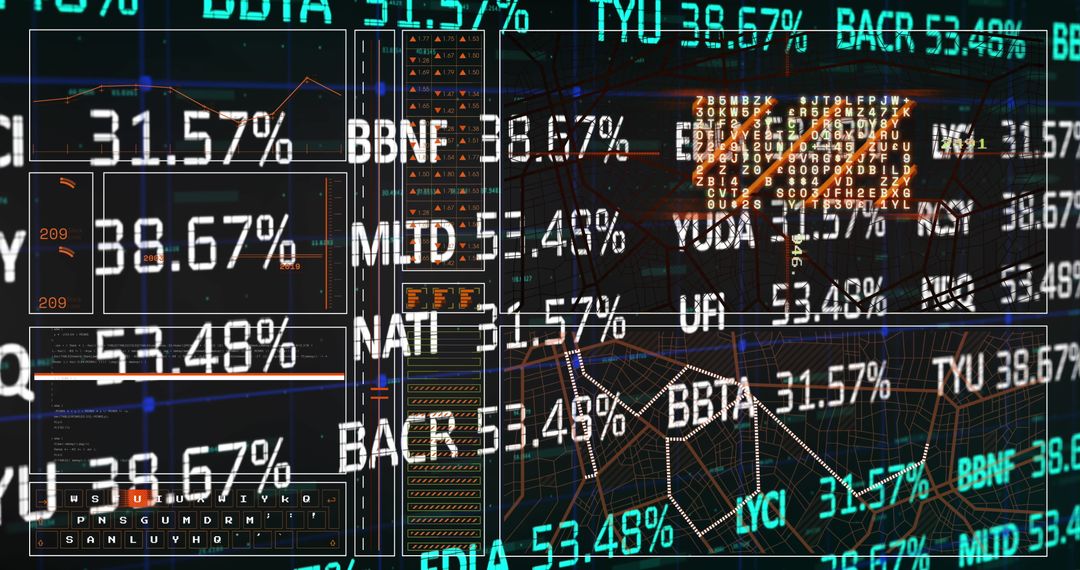
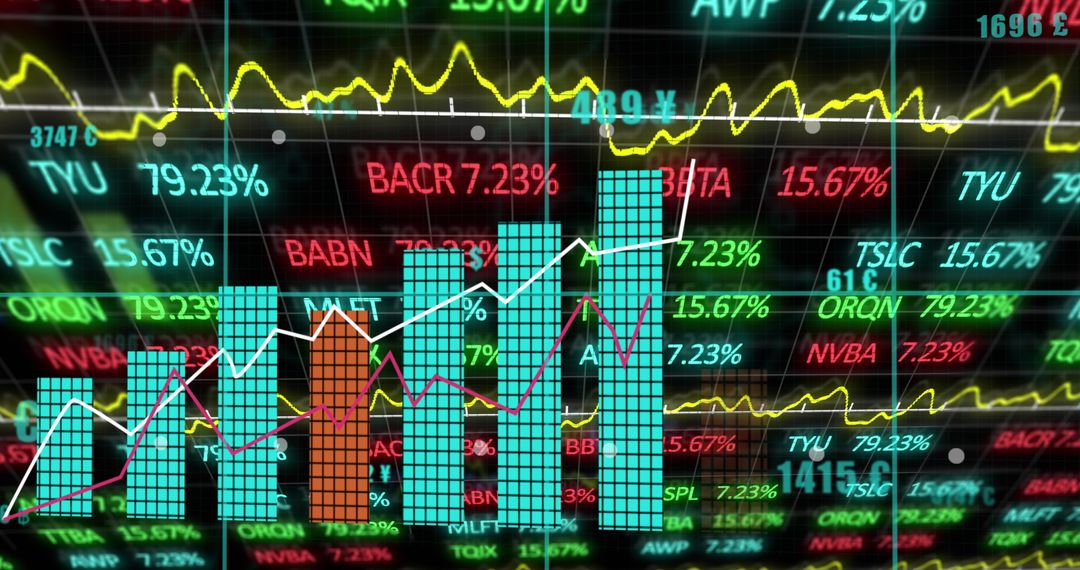
- Futuristic Digital Trading Interface with Percentages and Data Visuals
Futuristic Digital Trading Interface with Percentages and Data Visuals Image
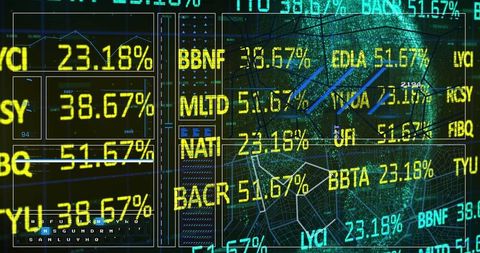
This captivating depiction showcases a futuristic digital trading interface. Bright yellow percentages and ticker symbols float over an intricate grid map featuring chart lines. Ideal for articles and media related to finance, stock trading, data analysis, digital visualization techniques, or technology advancements. Great resource for educators doing explainer lessons about modern financial analytics or marketing the latest trading software.
Powered by 


2
downloads
downloads
Tags:
More
Credit Photo
If you would like to credit the Photo, here are some ways you can do so
Text Link
photo Link
<span class="text-link">
<span>
<a target="_blank" href=https://pikwizard.com/photo/futuristic-digital-trading-interface-with-percentages-and-data-visuals/2e3ac588500c689289139bc934fea8c7/>PikWizard</a>
</span>
</span>
<span class="image-link">
<span
style="margin: 0 0 20px 0; display: inline-block; vertical-align: middle; width: 100%;"
>
<a
target="_blank"
href="https://pikwizard.com/photo/futuristic-digital-trading-interface-with-percentages-and-data-visuals/2e3ac588500c689289139bc934fea8c7/"
style="text-decoration: none; font-size: 10px; margin: 0;"
>
<img src="https://pikwizard.com/pw/medium/2e3ac588500c689289139bc934fea8c7.jpg" style="margin: 0; width: 100%;" alt="" />
<p style="font-size: 12px; margin: 0;">PikWizard</p>
</a>
</span>
</span>
Free (free of charge)
Free for personal and commercial use.
Author: Creative Art
Similar Free Stock Images

Premium

Premium


Premium


Premium


Premium

Premium


Premium


Premium

Premium


Premium


Premium


Premium


Premium

Premium


Premium


Premium

Premium

Premium


Premium


Premium


Premium


Premium


Premium


Premium