
- Home >
- Stock Photos >
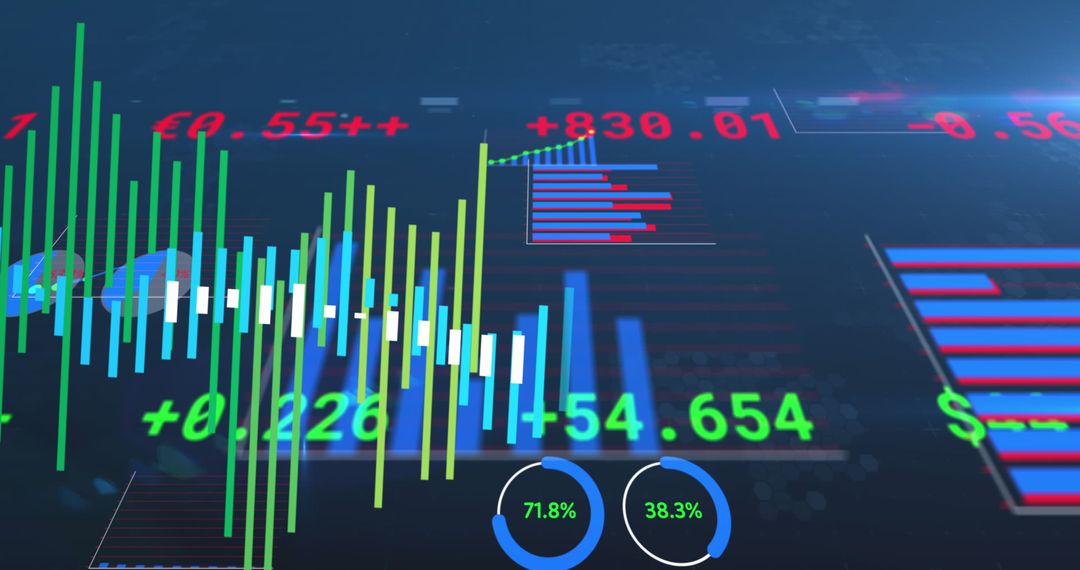
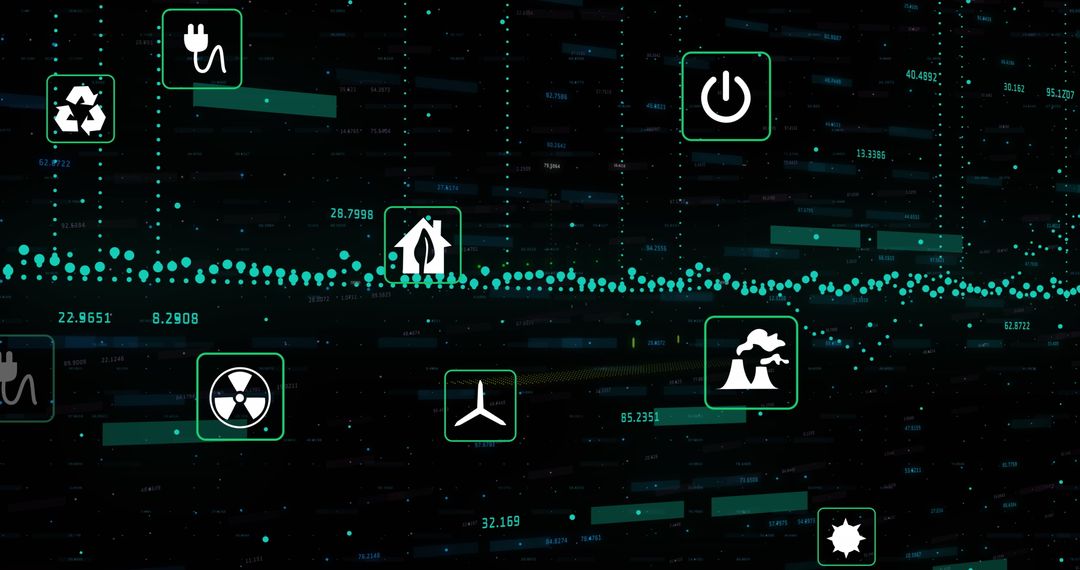
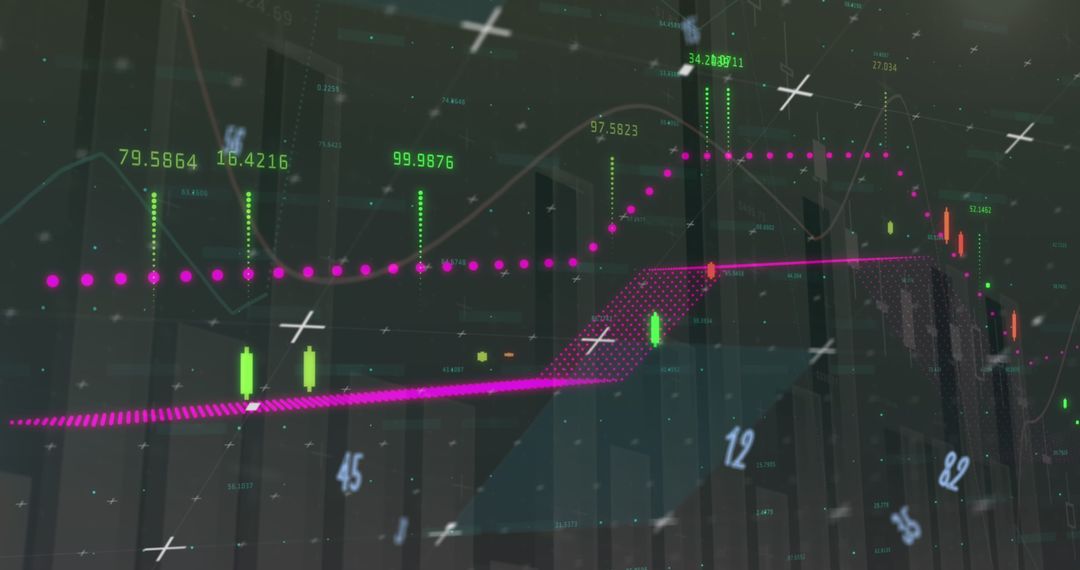
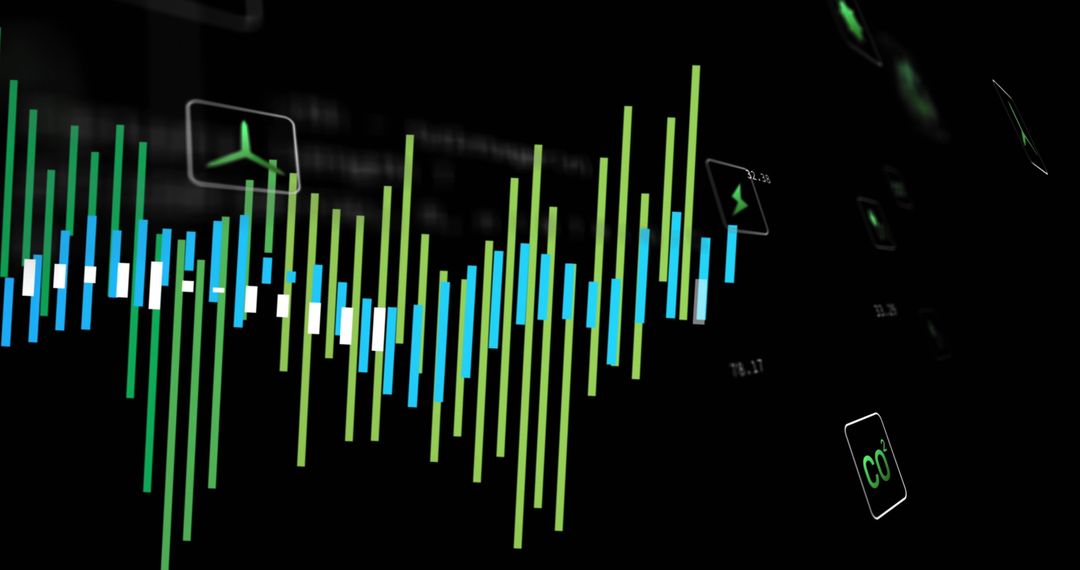
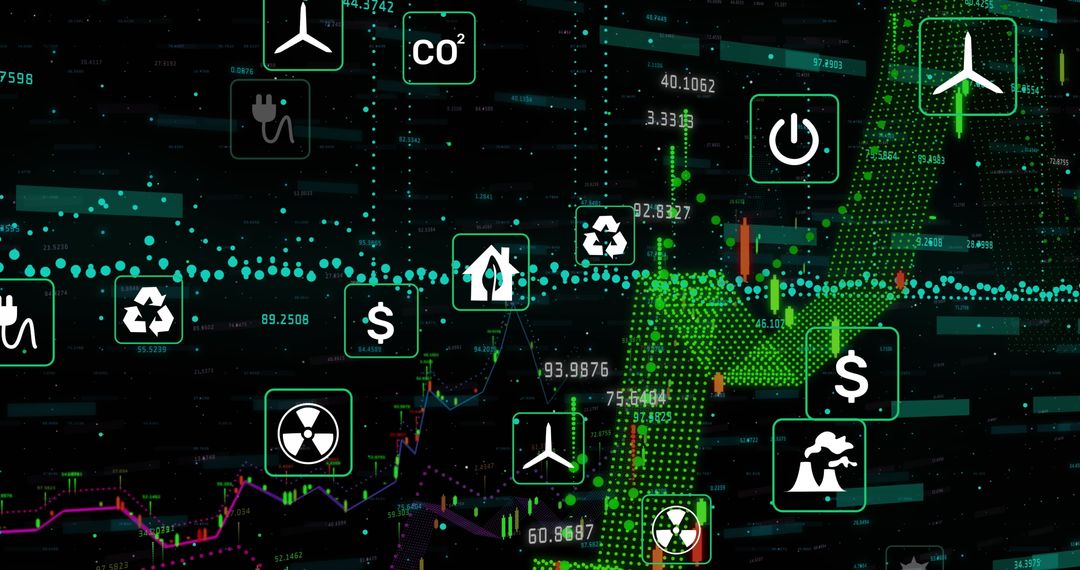
- Futuristic Energy Data Analytics with Green Power Icons on Black Interface
Futuristic Energy Data Analytics with Green Power Icons on Black Interface Image

Visual style suitable for presentations about renewable energy, sustainability solutions, financial predictions in energy markets, and technological data assessments. Ideal use for educators discussing trends in sustainable practices or finance professionals illustrating market shifts.
Powered by  - Get 15% off with code: PIKWIZARD15


0
downloads
downloads
Tags:
More
Credit Photo
If you would like to credit the Photo, here are some ways you can do so
Text Link
photo Link
<span class="text-link">
<span>
<a target="_blank" href=https://pikwizard.com/photo/futuristic-energy-data-analytics-with-green-power-icons-on-black-interface/50a7afef52ae957f7ae26704c47ce4da/>PikWizard</a>
</span>
</span>
<span class="image-link">
<span
style="margin: 0 0 20px 0; display: inline-block; vertical-align: middle; width: 100%;"
>
<a
target="_blank"
href="https://pikwizard.com/photo/futuristic-energy-data-analytics-with-green-power-icons-on-black-interface/50a7afef52ae957f7ae26704c47ce4da/"
style="text-decoration: none; font-size: 10px; margin: 0;"
>
<img src="https://pikwizard.com/pw/medium/50a7afef52ae957f7ae26704c47ce4da.jpg" style="margin: 0; width: 100%;" alt="" />
<p style="font-size: 12px; margin: 0;">PikWizard</p>
</a>
</span>
</span>
Free (free of charge)
Free for personal and commercial use.
Author: Authentic Images
Similar Free Stock Images

Premium


Premium


Premium


Premium


Premium


Premium


Premium


Premium


Premium


Premium


Premium


Premium


Premium


Premium


Premium


Premium


Premium


Premium


Premium


Premium


Premium


Premium


Premium


Premium

