- Home >
- Stock Photos >
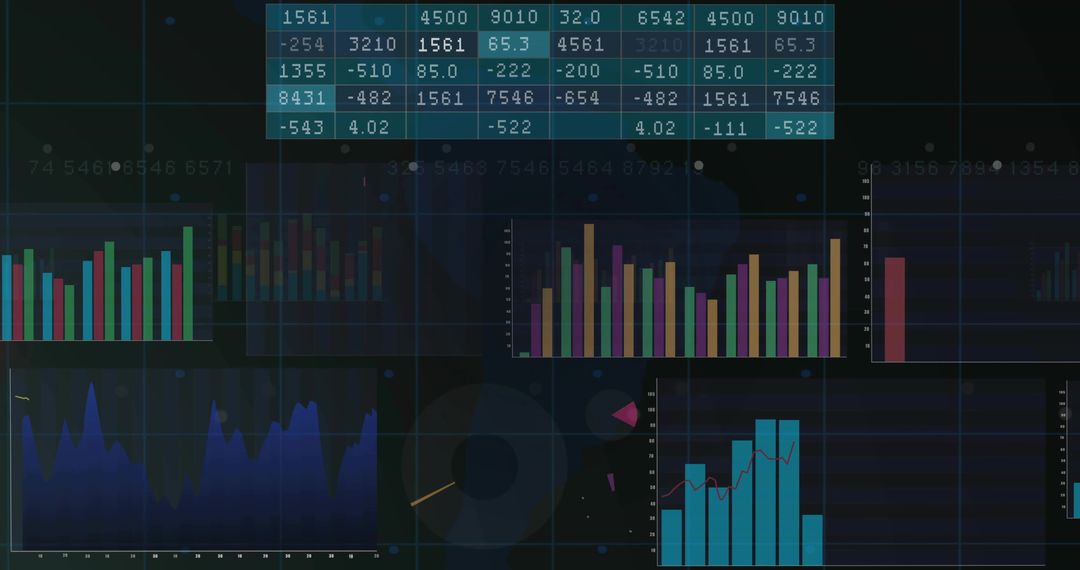
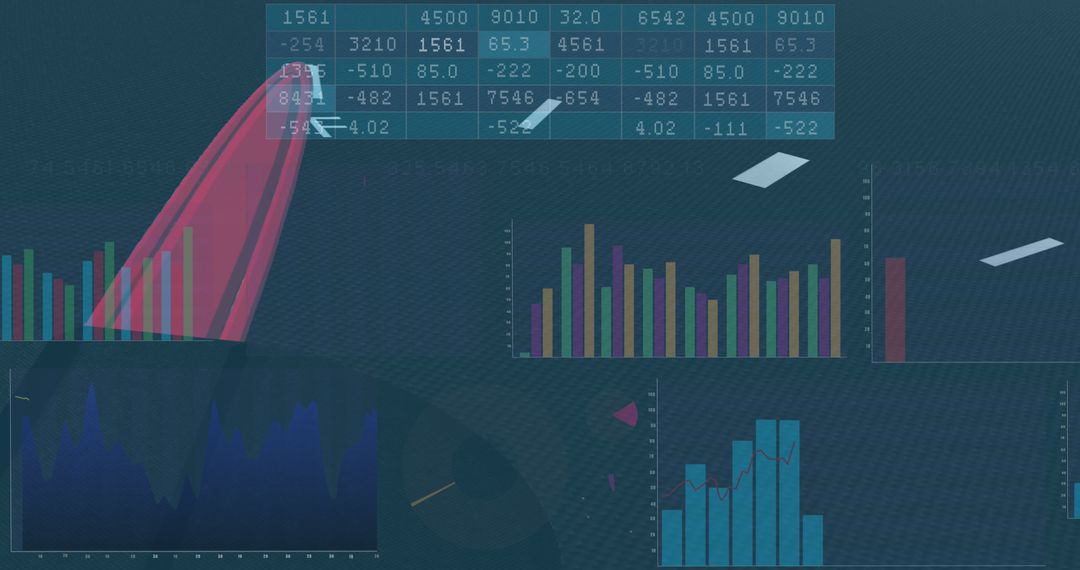
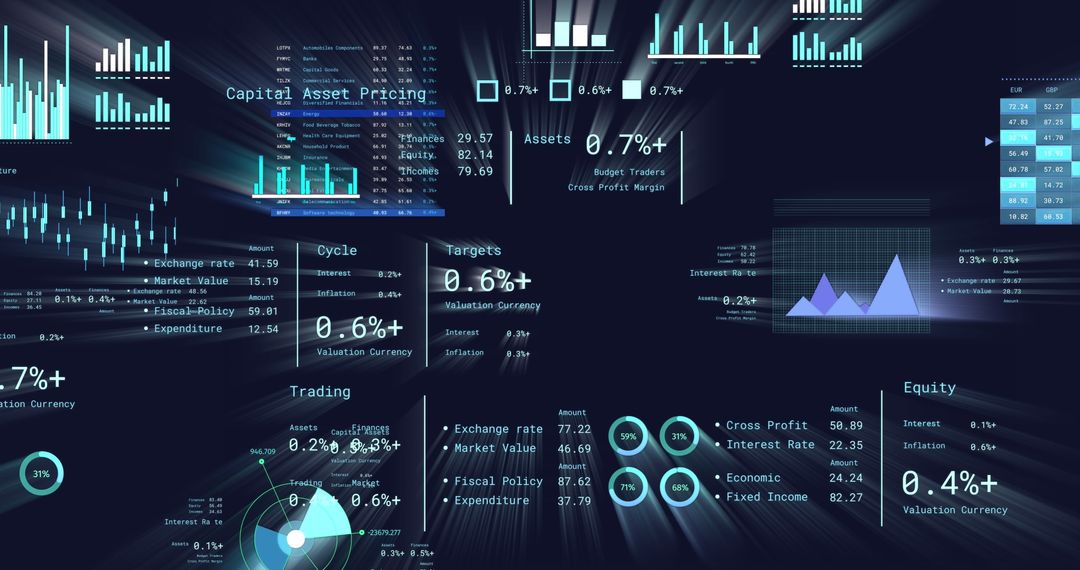
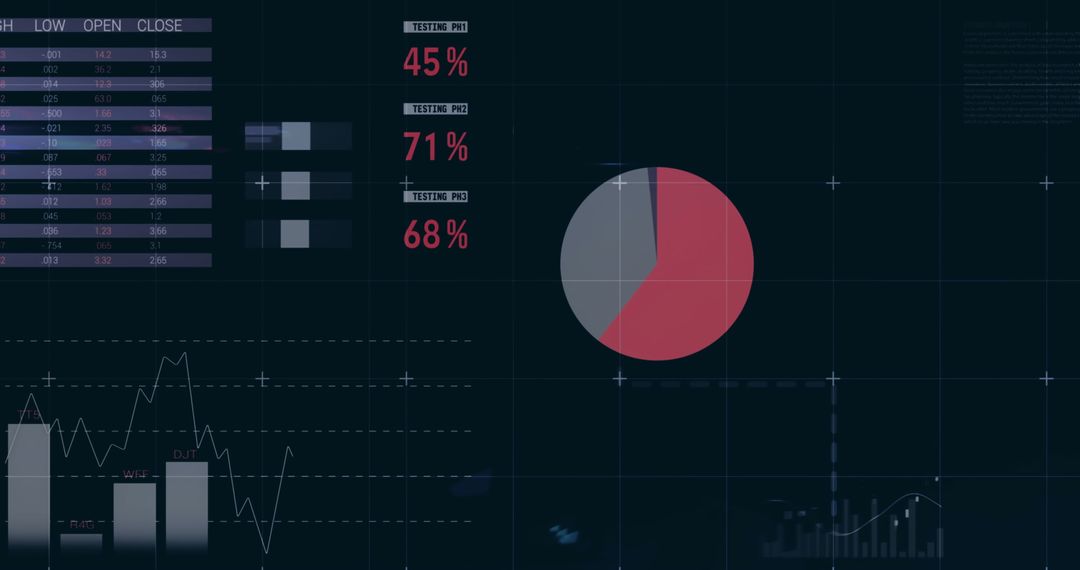
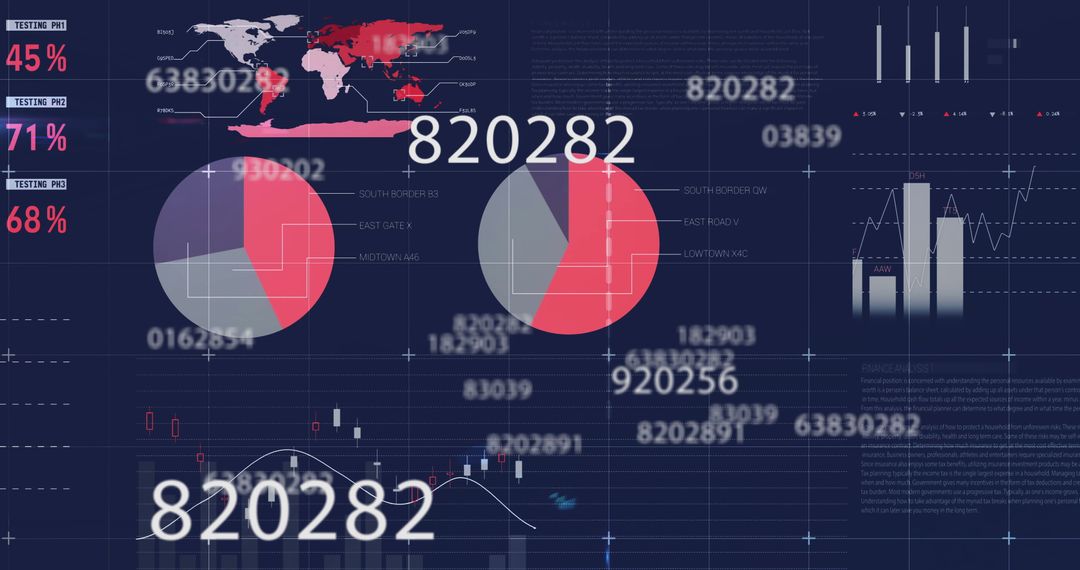
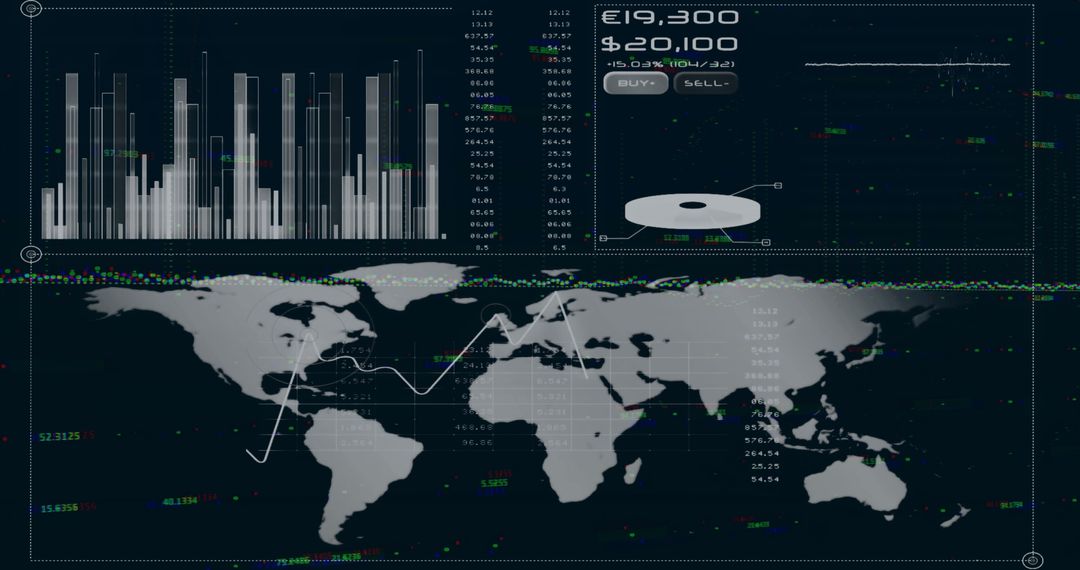
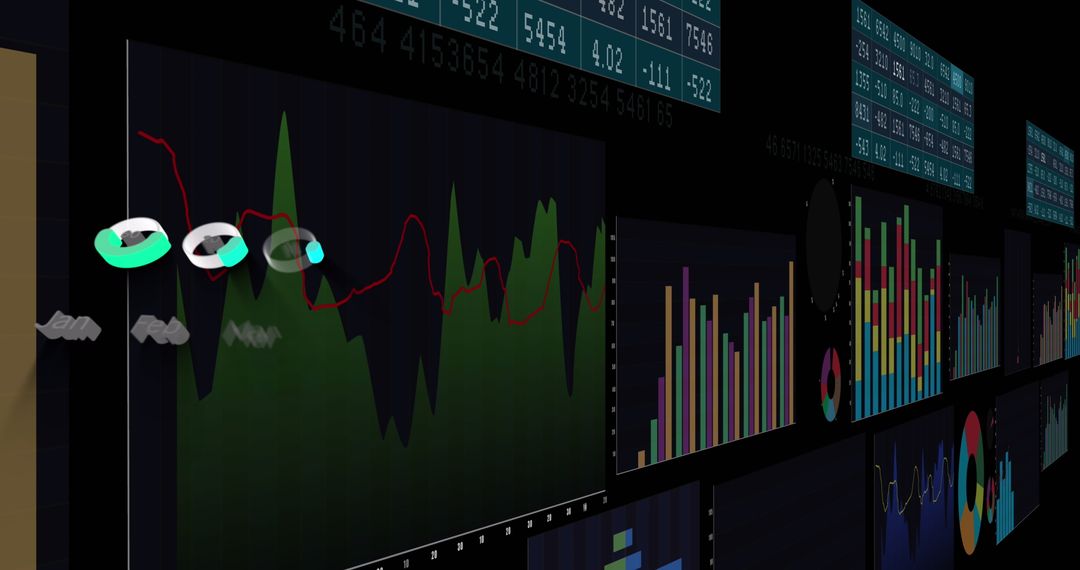
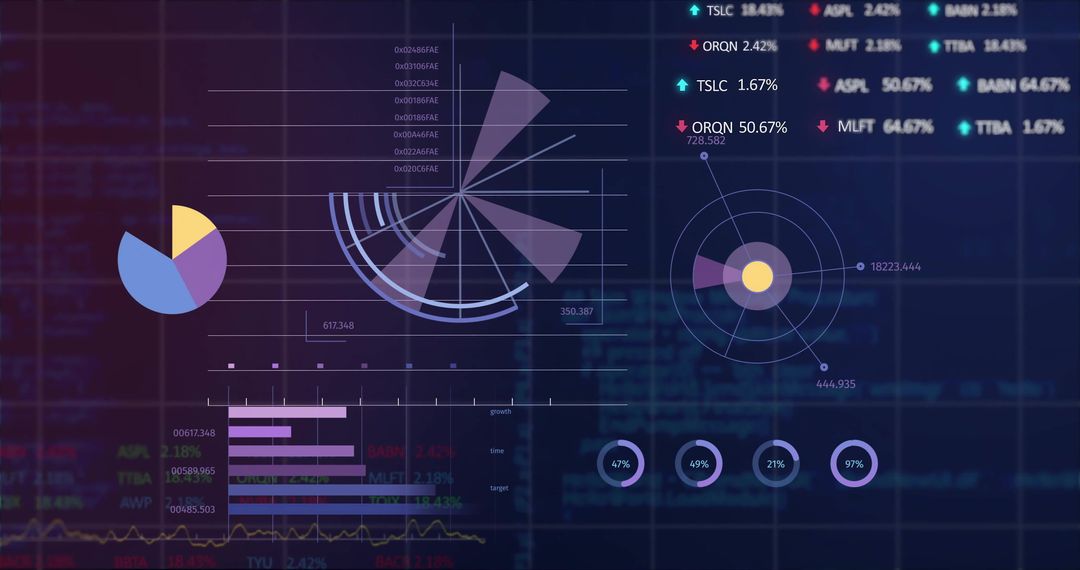
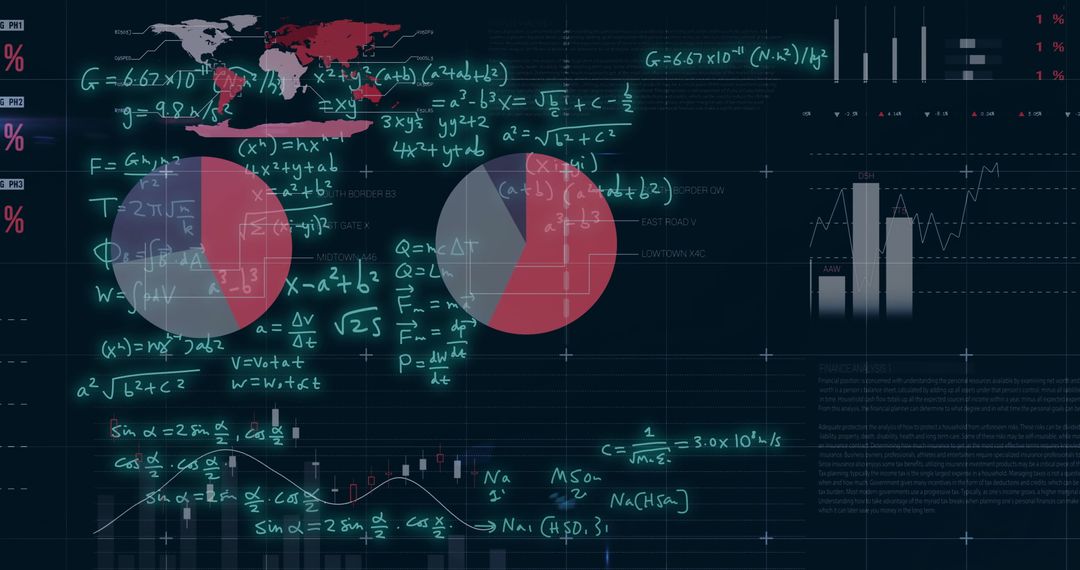
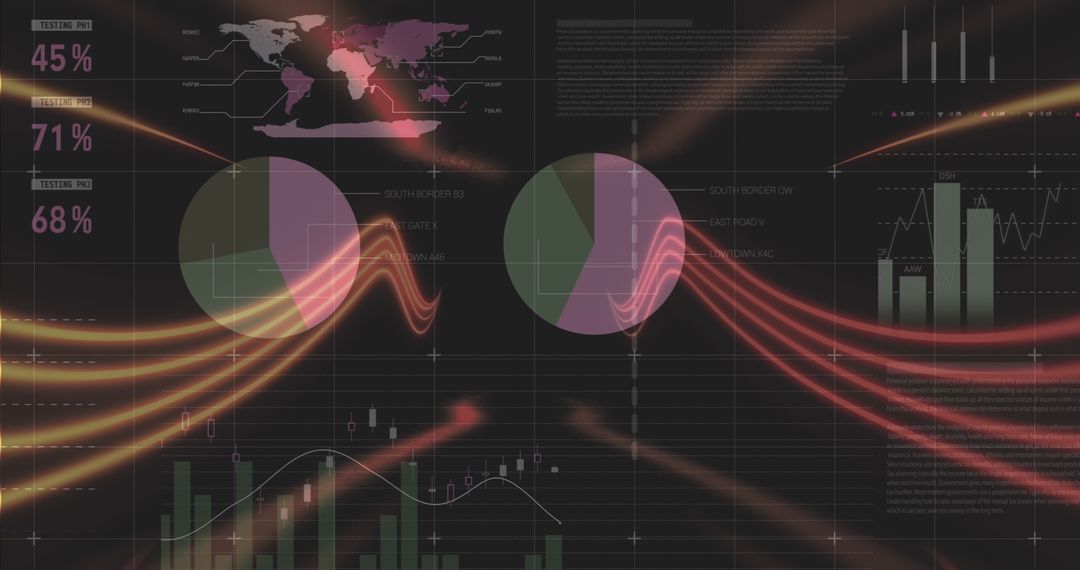
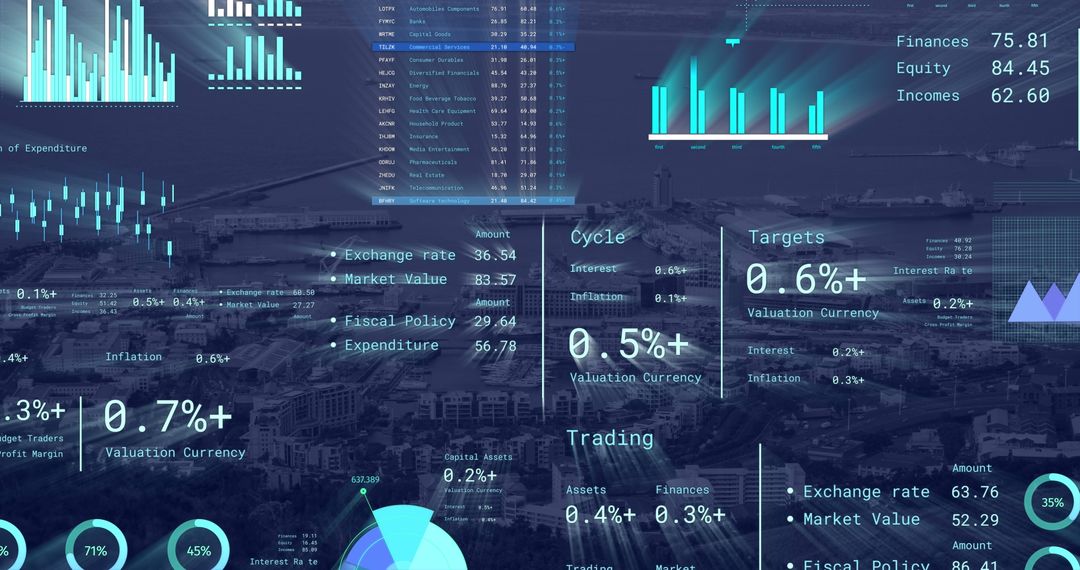
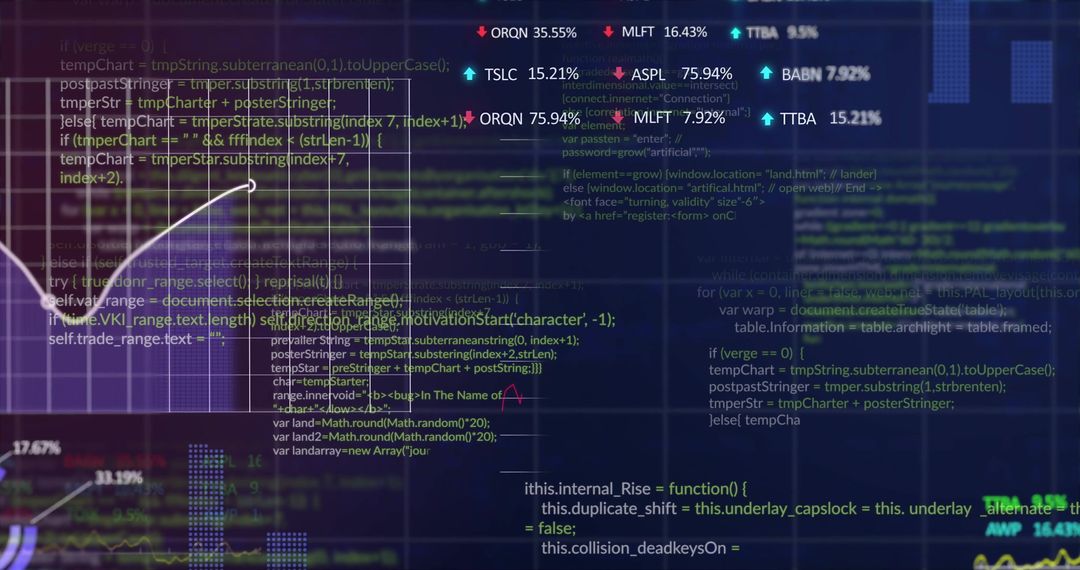
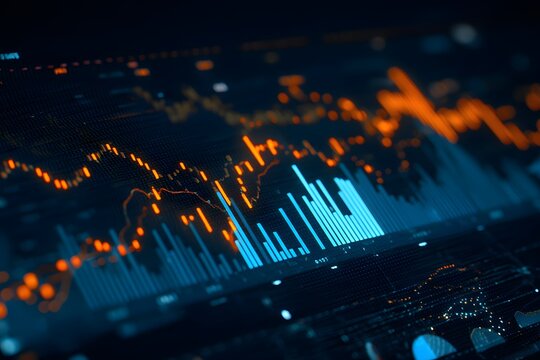
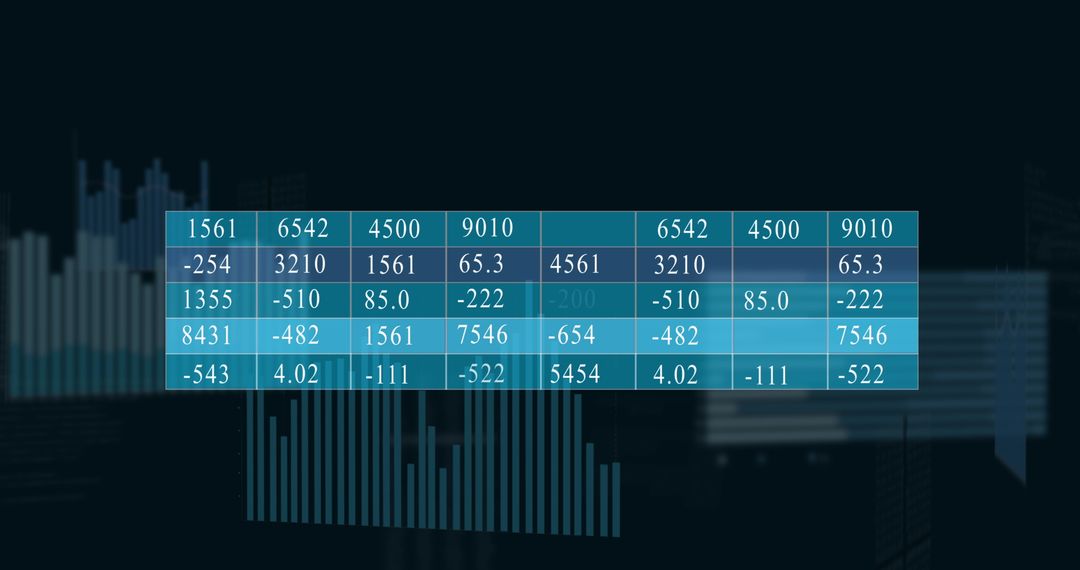
- Futuristic Finance Charts with Digital Effects and Geometric Shapes
Futuristic Finance Charts with Digital Effects and Geometric Shapes Image
A sophisticated collection of financial charts and datasets displayed over abstract geometric forms enhanced with dynamic lightning effects. Ideal for businesses, financial platforms, technology companies, and projects highlighting analytical capabilities or modern digital innovation. Perfect for presentations, digital advertising, or any design needing a high-tech financial theme.
Powered by 


2
downloads
downloads
Tags:
More
Credit Photo
If you would like to credit the Photo, here are some ways you can do so
Text Link
photo Link
<span class="text-link">
<span>
<a target="_blank" href=https://pikwizard.com/photo/futuristic-finance-charts-with-digital-effects-and-geometric-shapes/b013392fcf981a4260367237c719ee65/>PikWizard</a>
</span>
</span>
<span class="image-link">
<span
style="margin: 0 0 20px 0; display: inline-block; vertical-align: middle; width: 100%;"
>
<a
target="_blank"
href="https://pikwizard.com/photo/futuristic-finance-charts-with-digital-effects-and-geometric-shapes/b013392fcf981a4260367237c719ee65/"
style="text-decoration: none; font-size: 10px; margin: 0;"
>
<img src="https://pikwizard.com/pw/medium/b013392fcf981a4260367237c719ee65.jpg" style="margin: 0; width: 100%;" alt="" />
<p style="font-size: 12px; margin: 0;">PikWizard</p>
</a>
</span>
</span>
Free (free of charge)
Free for personal and commercial use.
Author: Authentic Images
Similar Free Stock Images

Premium


Premium


Premium


Premium


Premium


Premium


Premium

Premium


Premium


Premium


Premium


Premium


Premium


Premium


Premium


Premium


Premium


Premium


Premium


Premium


Premium


Premium


Premium


Premium


Premium