
- Home >
- Stock Photos >
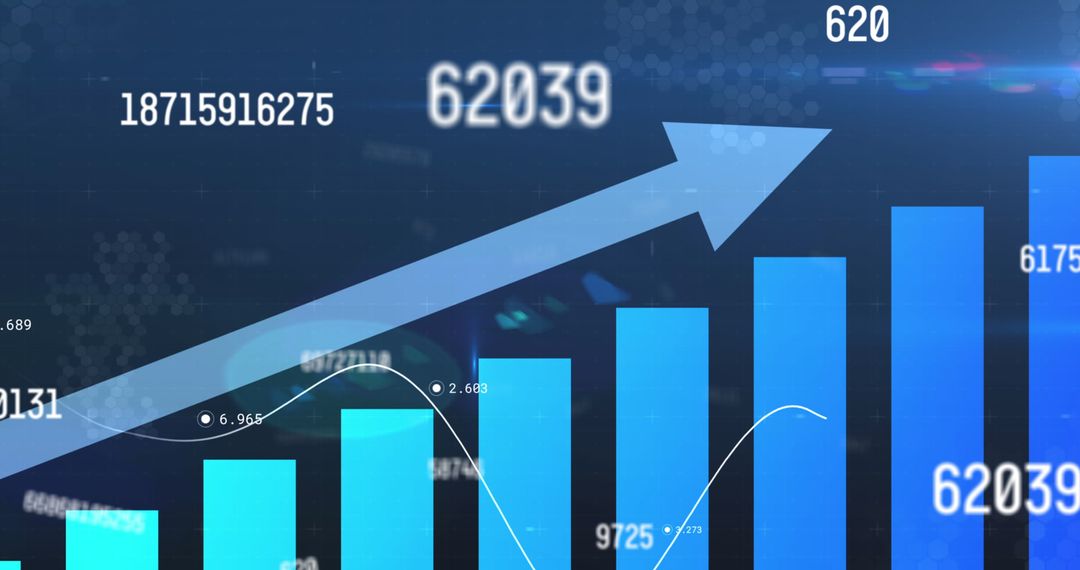
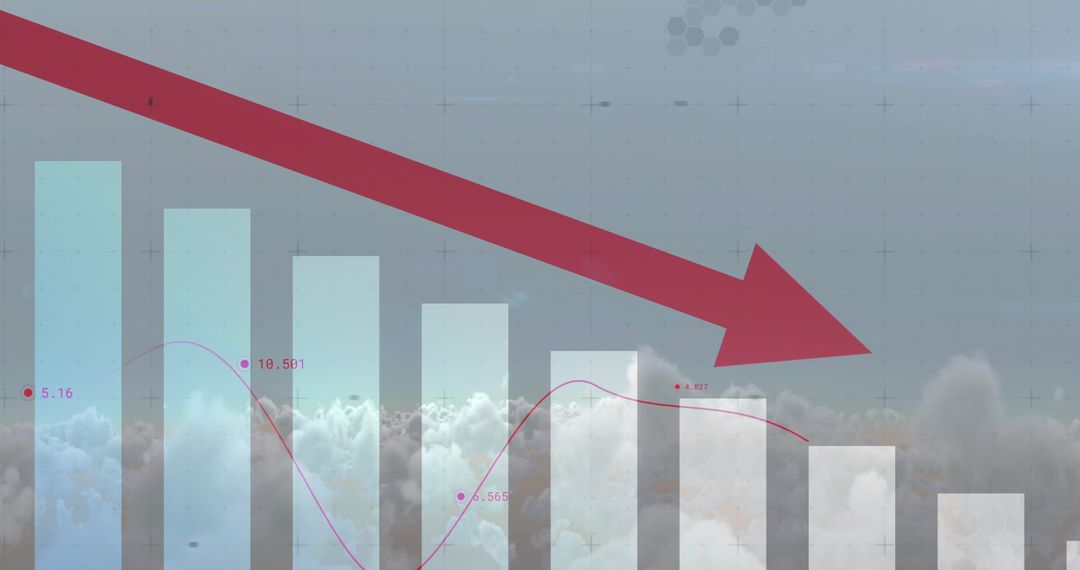
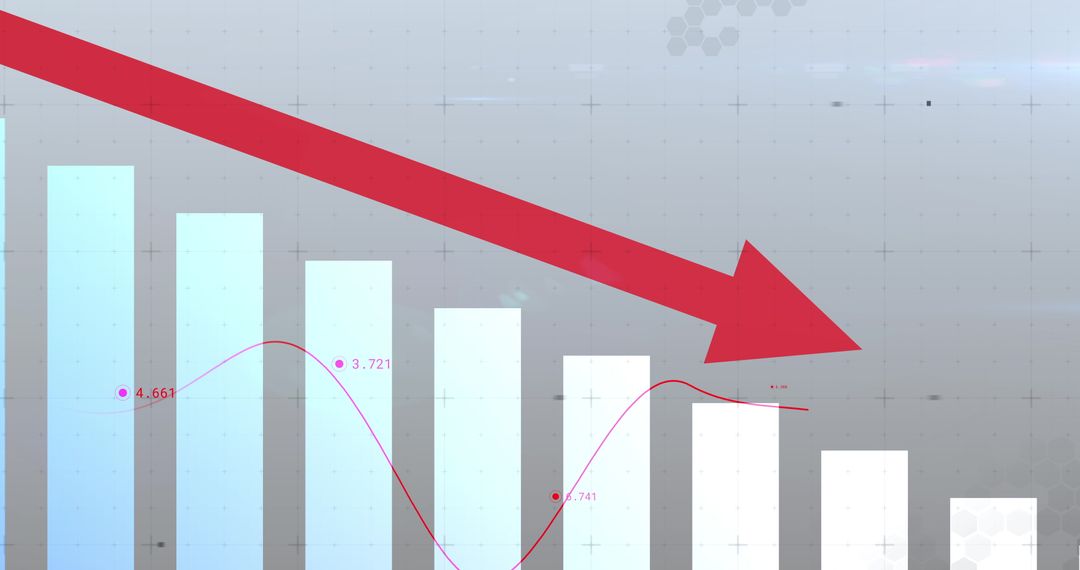
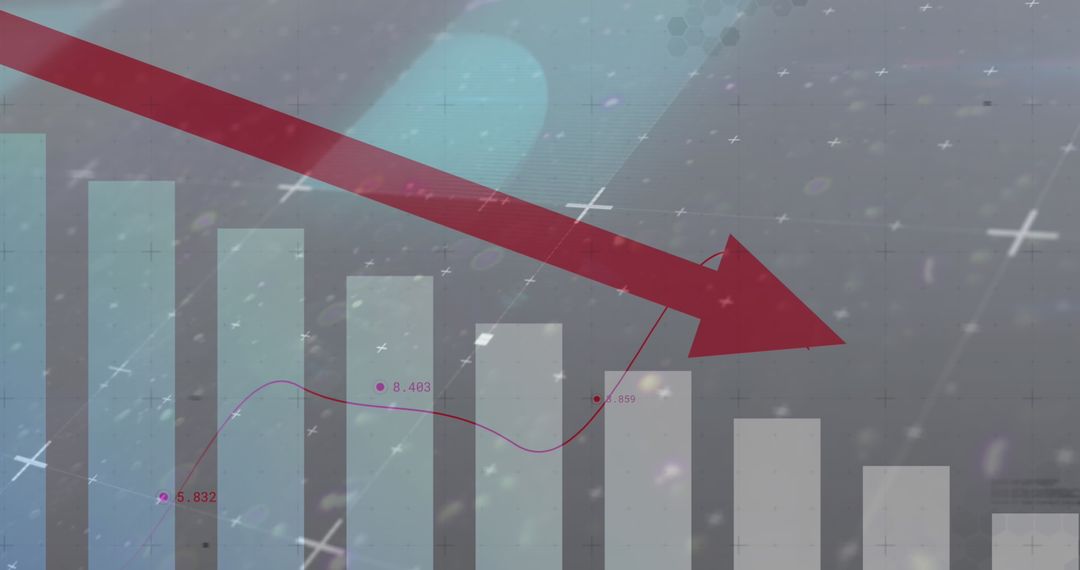
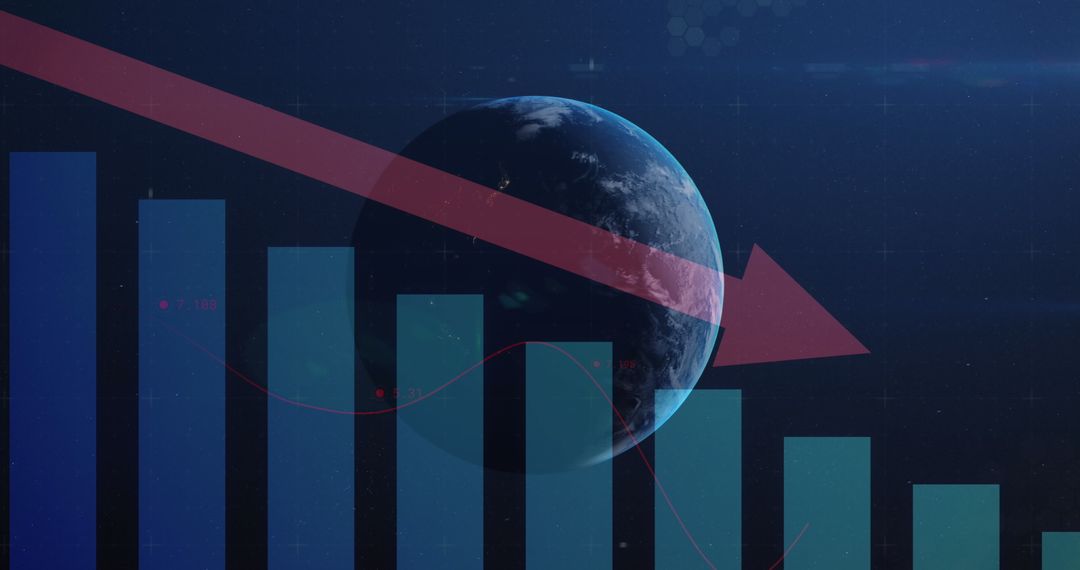
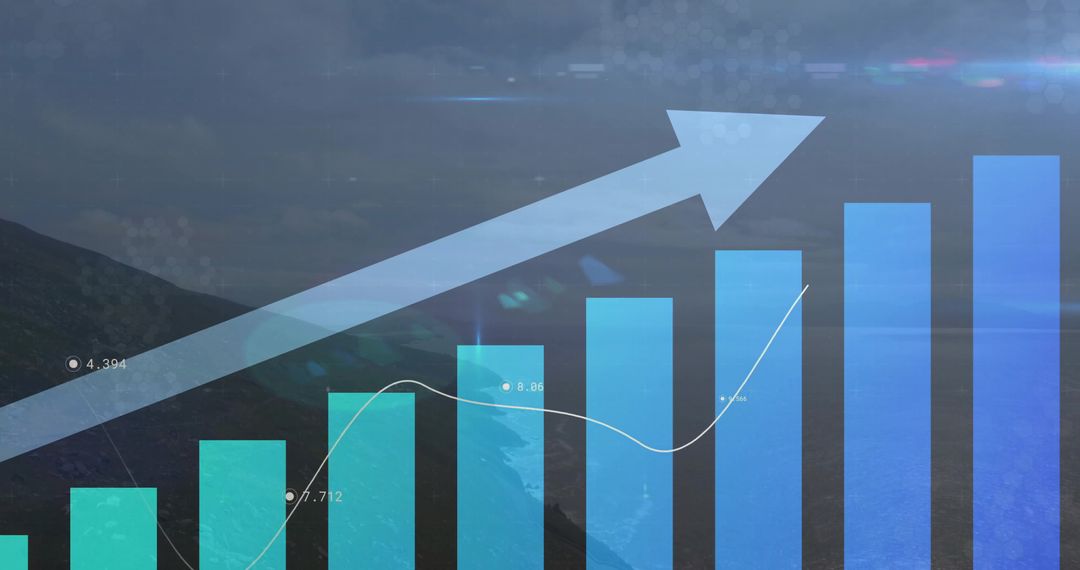
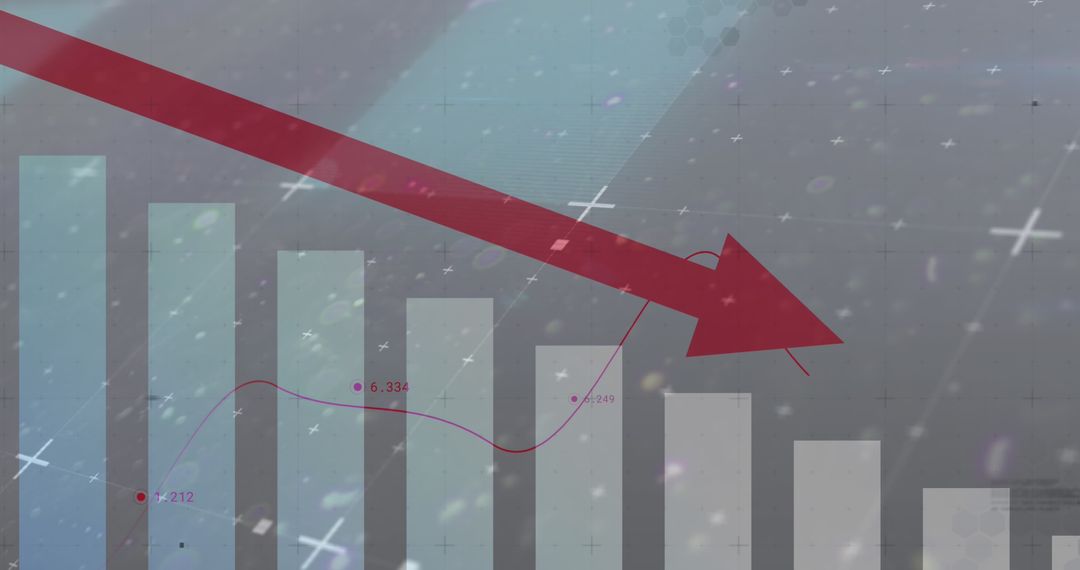
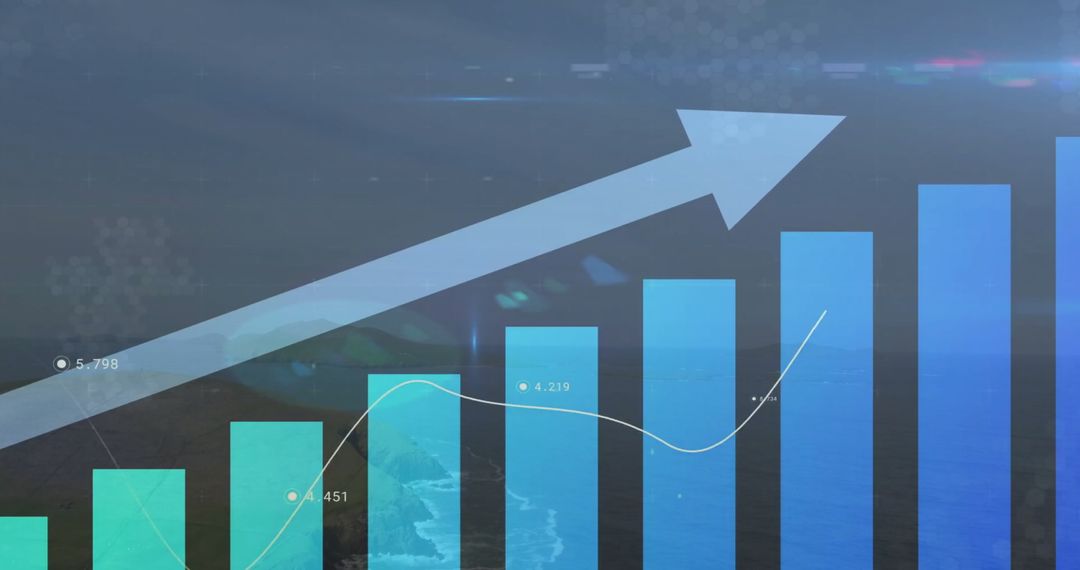
- Futuristic Financial Analytics with Data Charts and Graphs
Futuristic Financial Analytics with Data Charts and Graphs Image

Visual represents global business analytics using futuristic digital interfaces. Blue background and visual data elements like bar graphs and pie charts depict financial analysis and digital transformation. Suited for illustrating concepts in global financial trends, technological advancement in data sciences, or business intelligence presentations.
Powered by  - Get 15% off with code: PIKWIZARD15


2
downloads
downloads
Tags:
More
Credit Photo
If you would like to credit the Photo, here are some ways you can do so
Text Link
photo Link
<span class="text-link">
<span>
<a target="_blank" href=https://pikwizard.com/photo/futuristic-financial-analytics-with-data-charts-and-graphs/9dc1440b03f94c27ce2af5f8e85249ea/>PikWizard</a>
</span>
</span>
<span class="image-link">
<span
style="margin: 0 0 20px 0; display: inline-block; vertical-align: middle; width: 100%;"
>
<a
target="_blank"
href="https://pikwizard.com/photo/futuristic-financial-analytics-with-data-charts-and-graphs/9dc1440b03f94c27ce2af5f8e85249ea/"
style="text-decoration: none; font-size: 10px; margin: 0;"
>
<img src="https://pikwizard.com/pw/medium/9dc1440b03f94c27ce2af5f8e85249ea.jpg" style="margin: 0; width: 100%;" alt="" />
<p style="font-size: 12px; margin: 0;">PikWizard</p>
</a>
</span>
</span>
Free (free of charge)
Free for personal and commercial use.
Author: Creative Art
Similar Free Stock Images

Premium


Premium


Premium


Premium


Premium


Premium


Premium


Premium


Premium


Premium


Premium


Premium


Premium


Premium


Premium


Premium


Premium


Premium


Premium


Premium


Premium


Premium


Premium


Premium

