
- Home >
- Stock Photos >
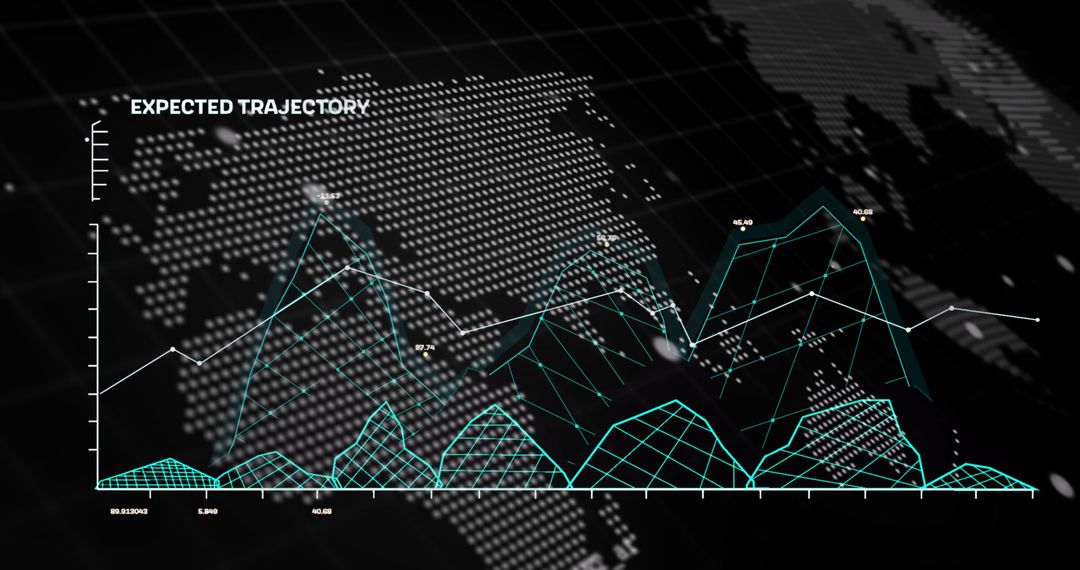
- Futuristic Financial Chart Showing Oscillating Trend Lines on 3D Grid Interface
Futuristic Financial Chart Showing Oscillating Trend Lines on 3D Grid Interface Image
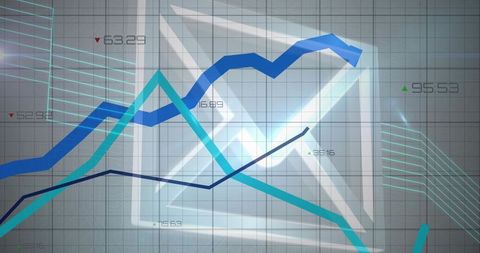
Depicting oscillating colored trend lines crossing translucent 3D grid while numeric arrow labels mark key data points. Featuring layered geometric shapes with glowing highlights and cool blue-teal palette to convey tech-forward mood. Working well for financial reports, market analysis presentations, fintech websites, investment pitch decks, data visualization demos, business intelligence dashboards. Supporting overlaying headline text, animating for video intros, adapting color palette to match brand identity. Providing negative space for logos and key metrics, helping emphasize trend movement and market volatility for editorial, marketing, or training use.
Powered by  - Get 15% off with code: PIKWIZARD15


0
downloads
downloads
Tags:
More
Credit Photo
If you would like to credit the Photo, here are some ways you can do so
Text Link
photo Link
<span class="text-link">
<span>
<a target="_blank" href=https://pikwizard.com/photo/futuristic-financial-chart-showing-oscillating-trend-lines-on-3d-grid-interface/8170b8beec1b6f1ca6bc9d2e26ec8e42/>PikWizard</a>
</span>
</span>
<span class="image-link">
<span
style="margin: 0 0 20px 0; display: inline-block; vertical-align: middle; width: 100%;"
>
<a
target="_blank"
href="https://pikwizard.com/photo/futuristic-financial-chart-showing-oscillating-trend-lines-on-3d-grid-interface/8170b8beec1b6f1ca6bc9d2e26ec8e42/"
style="text-decoration: none; font-size: 10px; margin: 0;"
>
<img src="https://pikwizard.com/pw/medium/8170b8beec1b6f1ca6bc9d2e26ec8e42.jpg" style="margin: 0; width: 100%;" alt="" />
<p style="font-size: 12px; margin: 0;">PikWizard</p>
</a>
</span>
</span>
Free (free of charge)
Free for personal and commercial use.
Author: Awesome Content
Similar Free Stock Images
Premium


Premium


Premium


Premium


Premium


Premium


Premium


Premium


Premium


Premium


Premium


Premium


Premium


Premium


Premium


Premium


Premium


Premium


Premium


Premium


Premium


Premium


Premium


Premium

