- Home >
- Stock Photos >
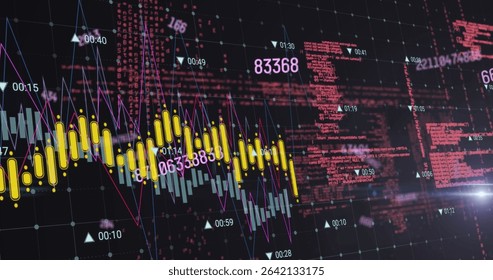
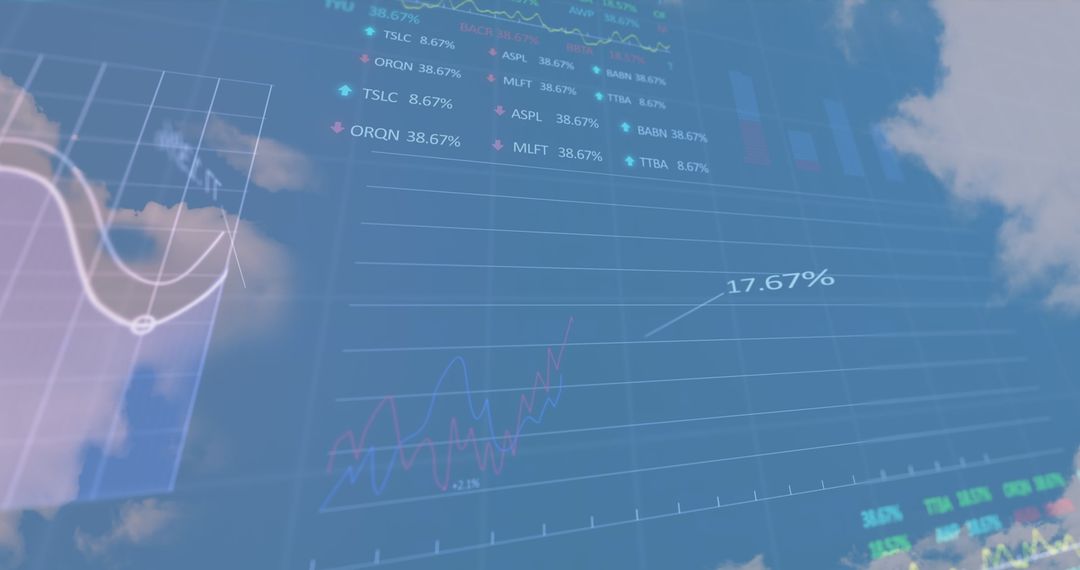
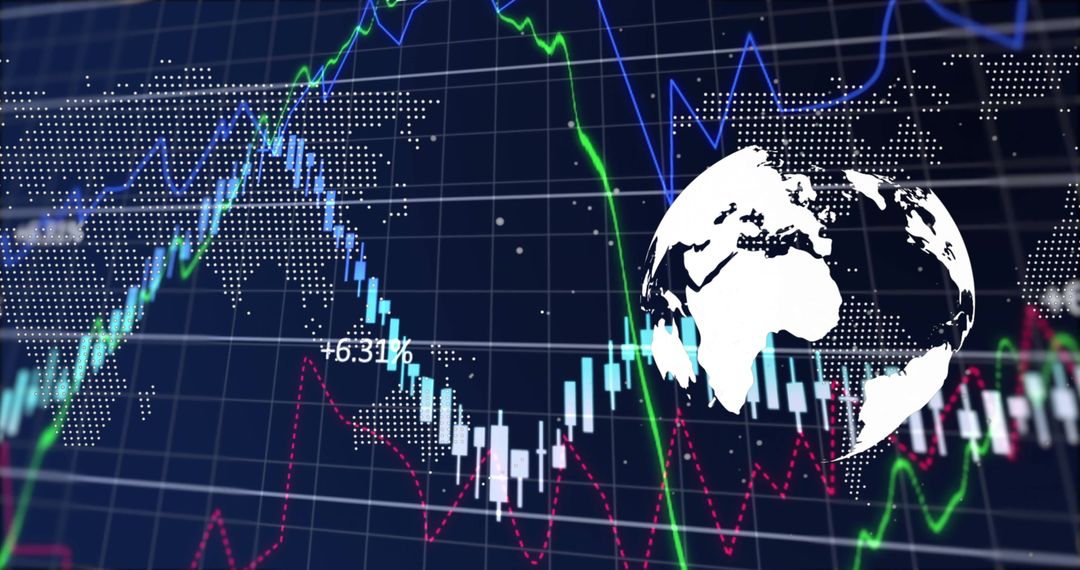
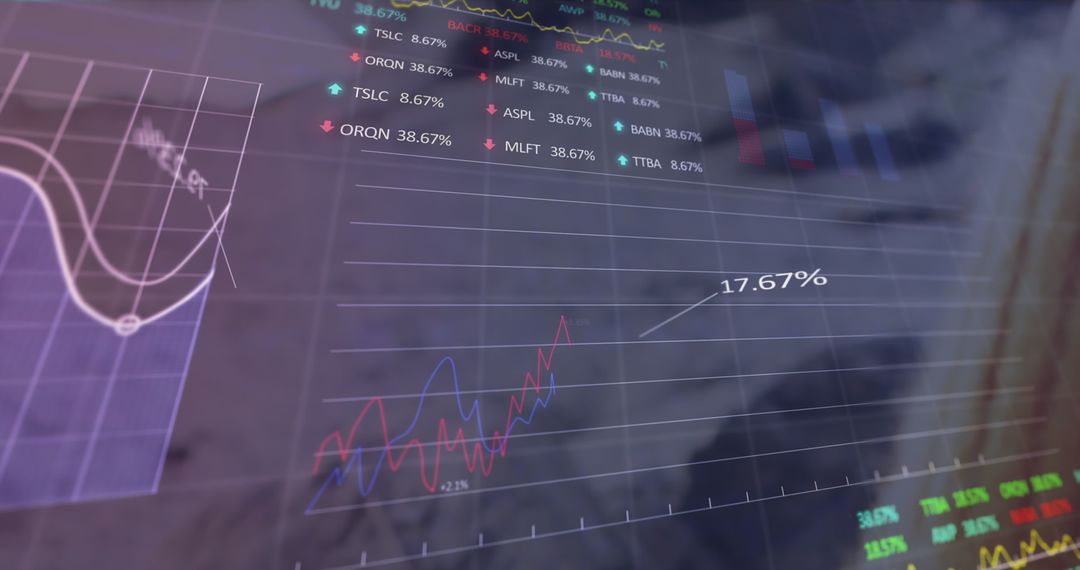
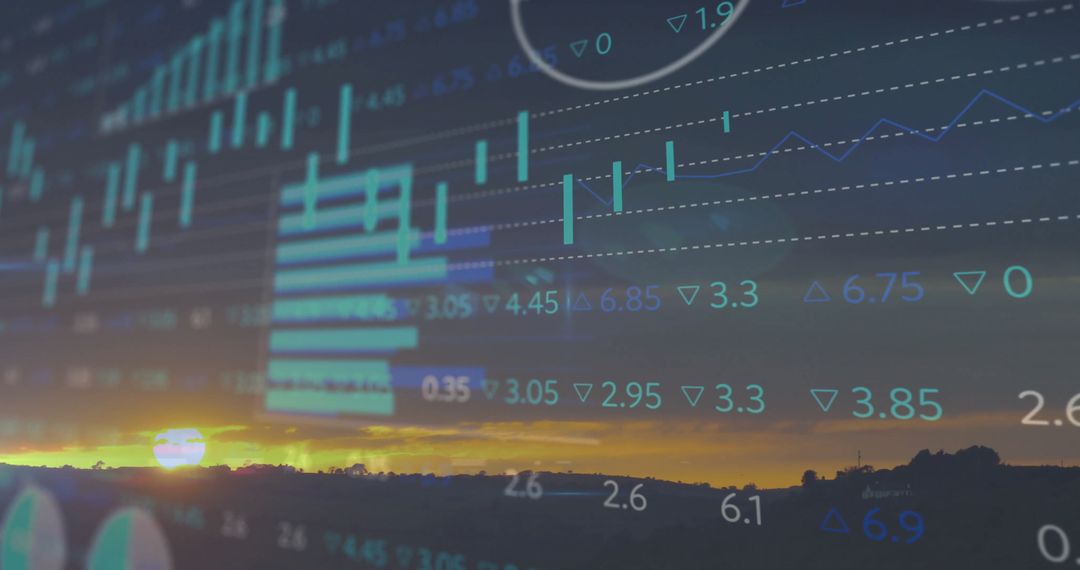
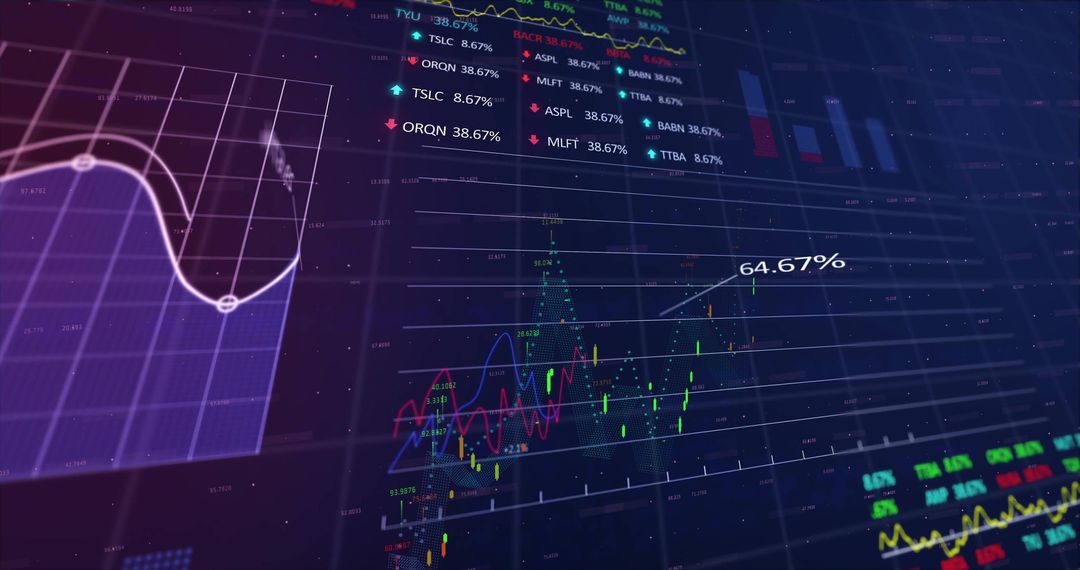
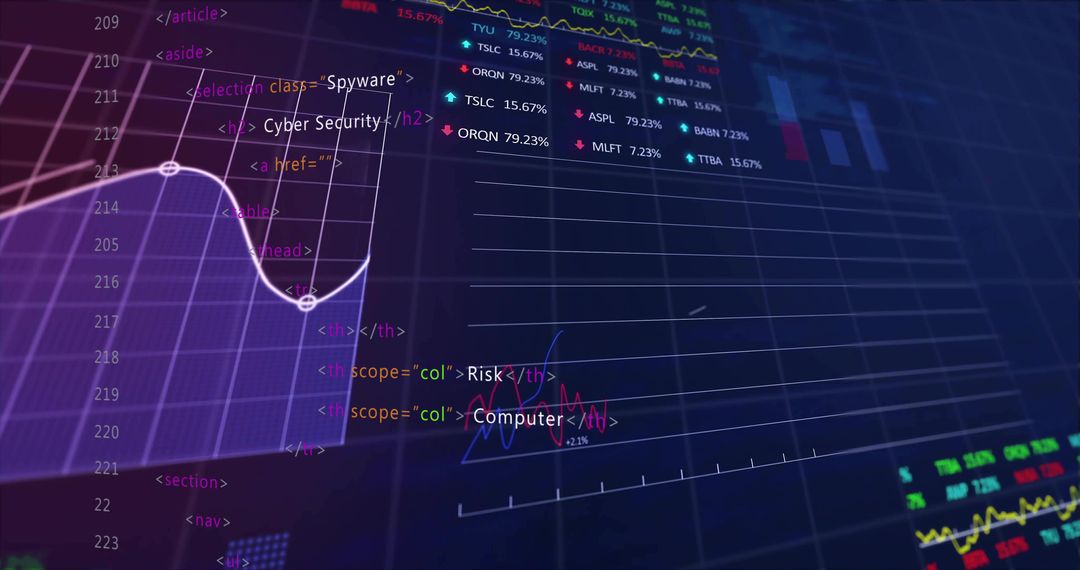
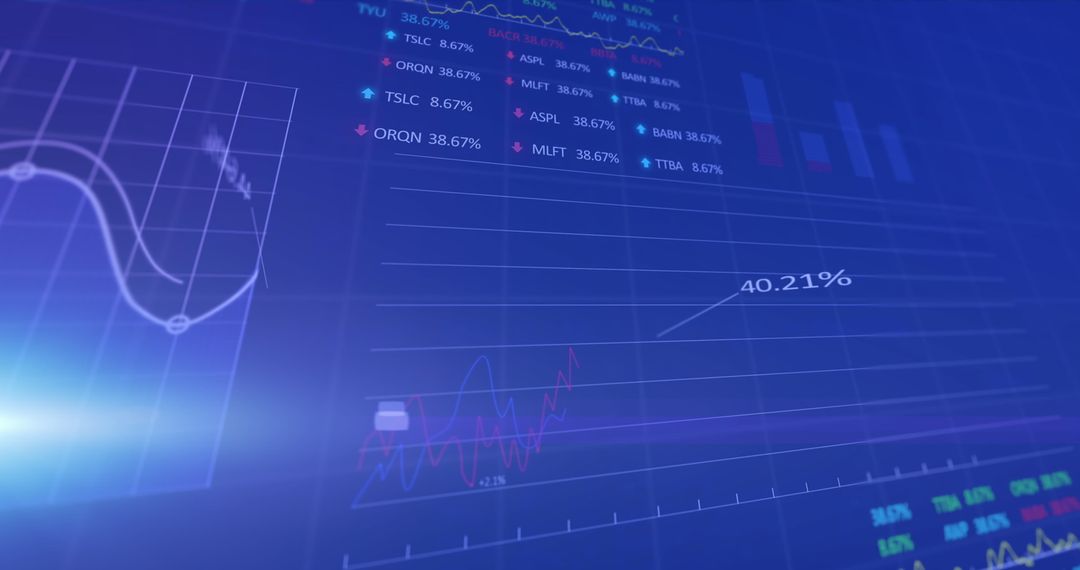
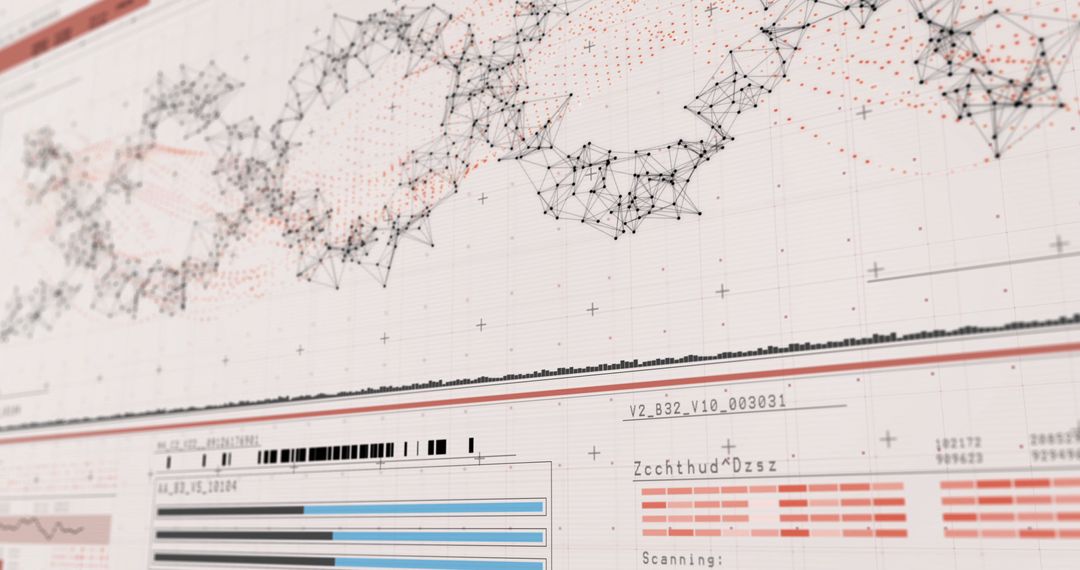
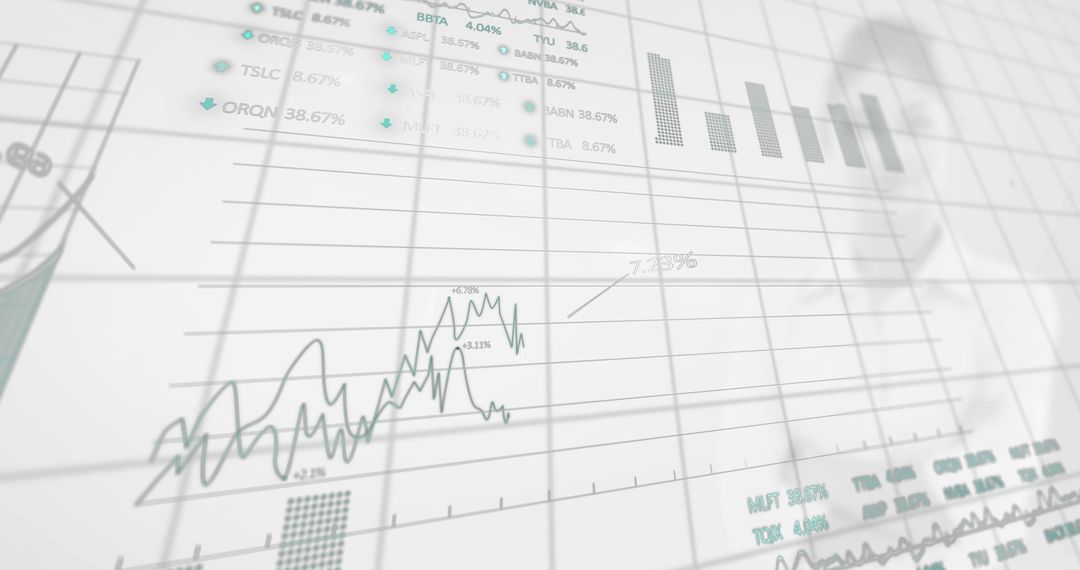
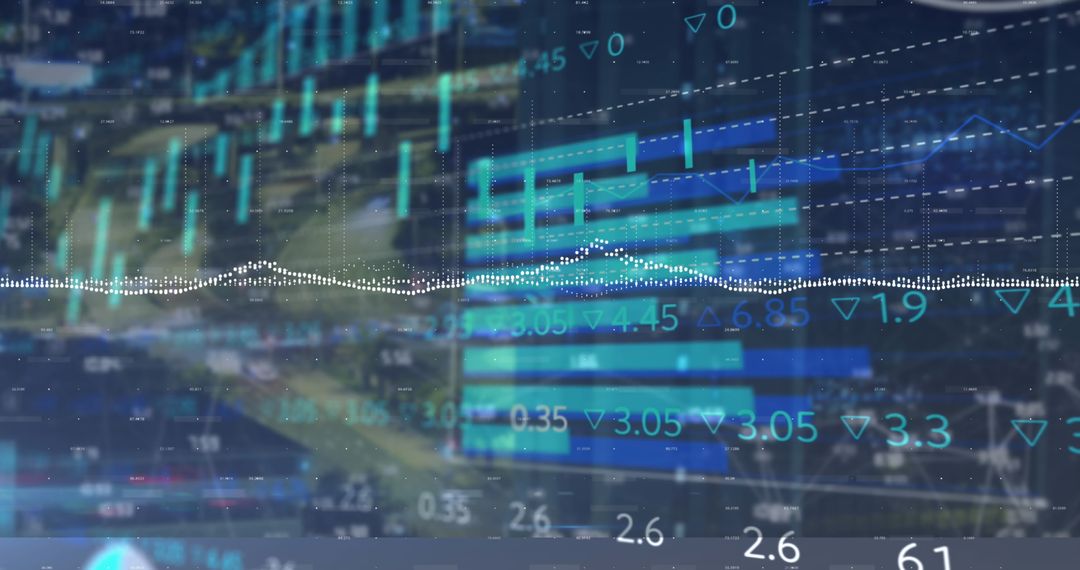
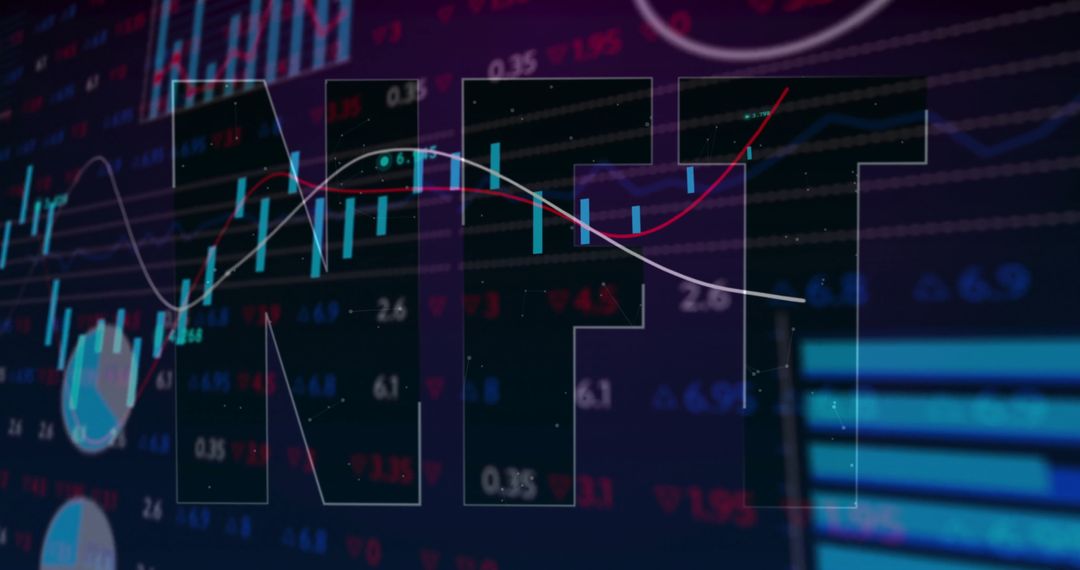
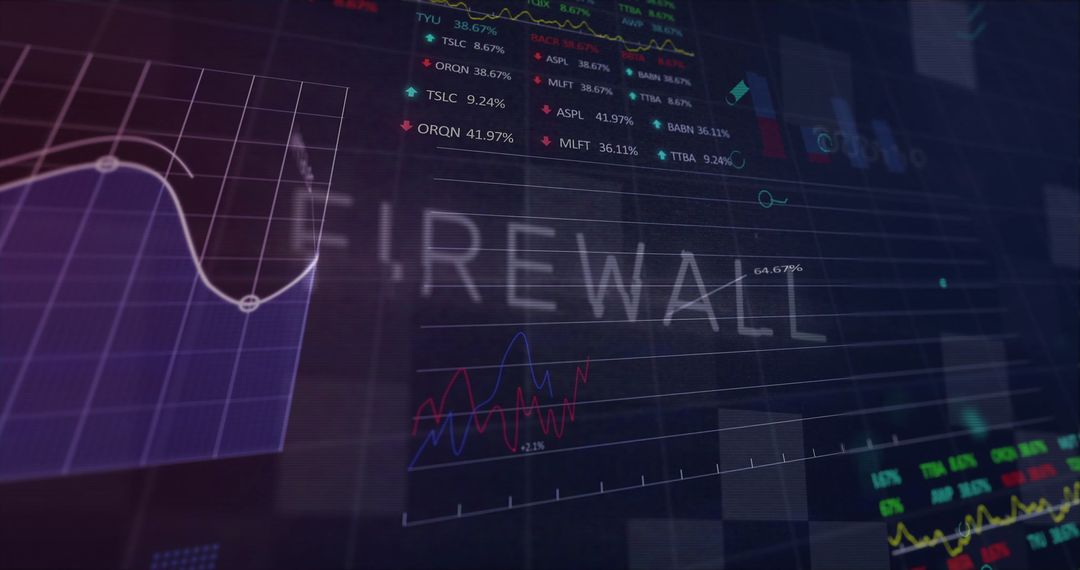
- Futuristic Financial Charts on Digital Dashboard
Futuristic Financial Charts on Digital Dashboard Image

Features a sophisticated view of financial analytics with interactive charts. Ideal for illustrating concepts in data science, business reporting, or online finance courses. Can be used in presentations about investing or financial technology advancements, providing a high-tech visualization of market trends.
Powered by  - Get 15% off with code: PIKWIZARD15


0
downloads
downloads
Tags:
More
Credit Photo
If you would like to credit the Photo, here are some ways you can do so
Text Link
photo Link
<span class="text-link">
<span>
<a target="_blank" href=https://pikwizard.com/photo/futuristic-financial-charts-on-digital-dashboard/632e90201f547e8134d9e2241b945be8/>PikWizard</a>
</span>
</span>
<span class="image-link">
<span
style="margin: 0 0 20px 0; display: inline-block; vertical-align: middle; width: 100%;"
>
<a
target="_blank"
href="https://pikwizard.com/photo/futuristic-financial-charts-on-digital-dashboard/632e90201f547e8134d9e2241b945be8/"
style="text-decoration: none; font-size: 10px; margin: 0;"
>
<img src="https://pikwizard.com/pw/medium/632e90201f547e8134d9e2241b945be8.jpg" style="margin: 0; width: 100%;" alt="" />
<p style="font-size: 12px; margin: 0;">PikWizard</p>
</a>
</span>
</span>
Free (free of charge)
Free for personal and commercial use.
Author: Awesome Content
Similar Free Stock Images

Premium


Premium


Premium


Premium


Premium


Premium


Premium


Premium


Premium


Premium


Premium


Premium


Premium


Premium


Premium


Premium


Premium


Premium


Premium


Premium


Premium


Premium


Premium


Premium