- Home >
- Stock Photos >
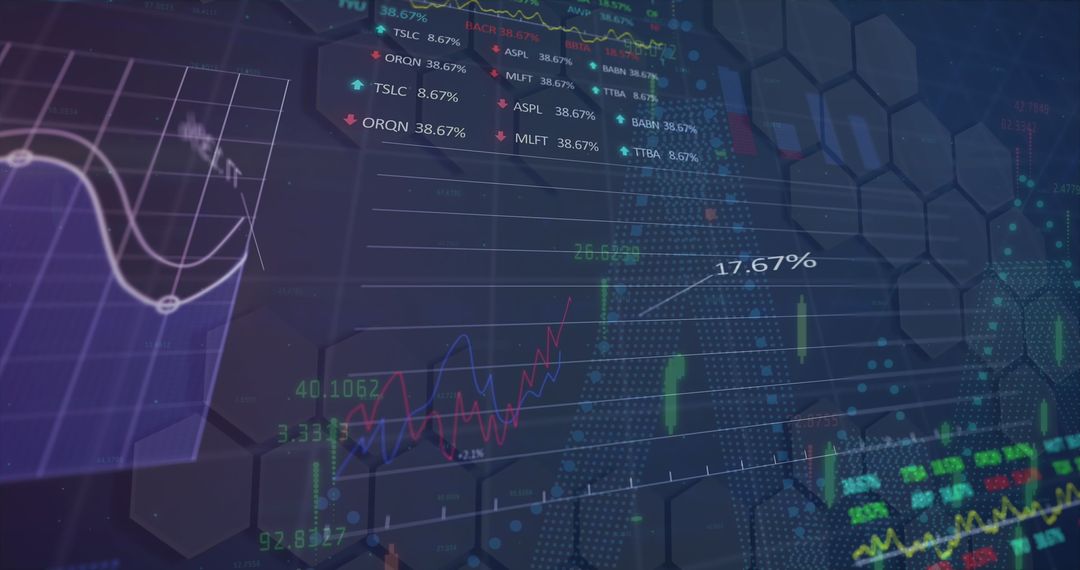
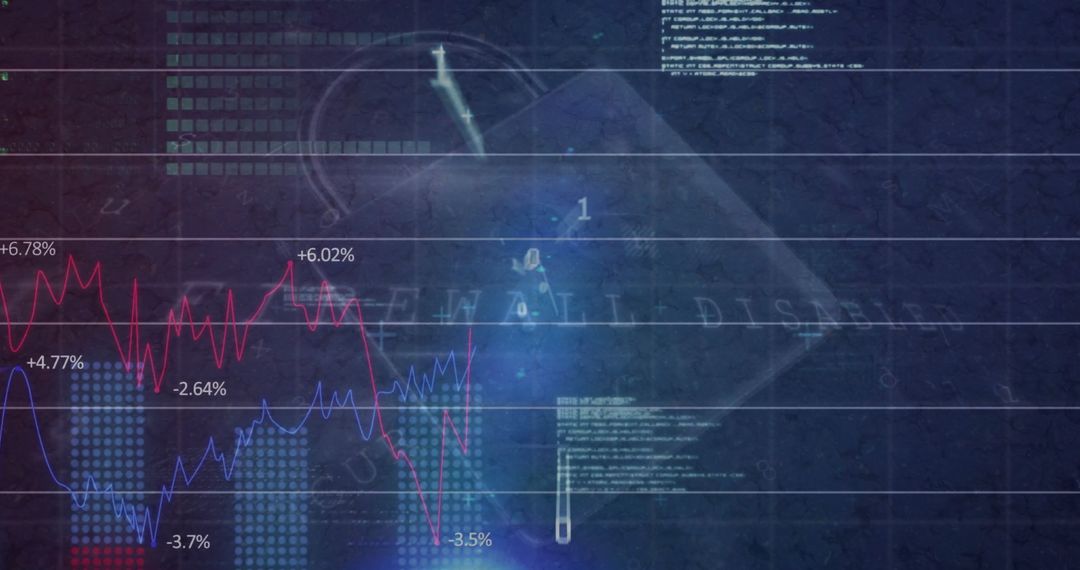
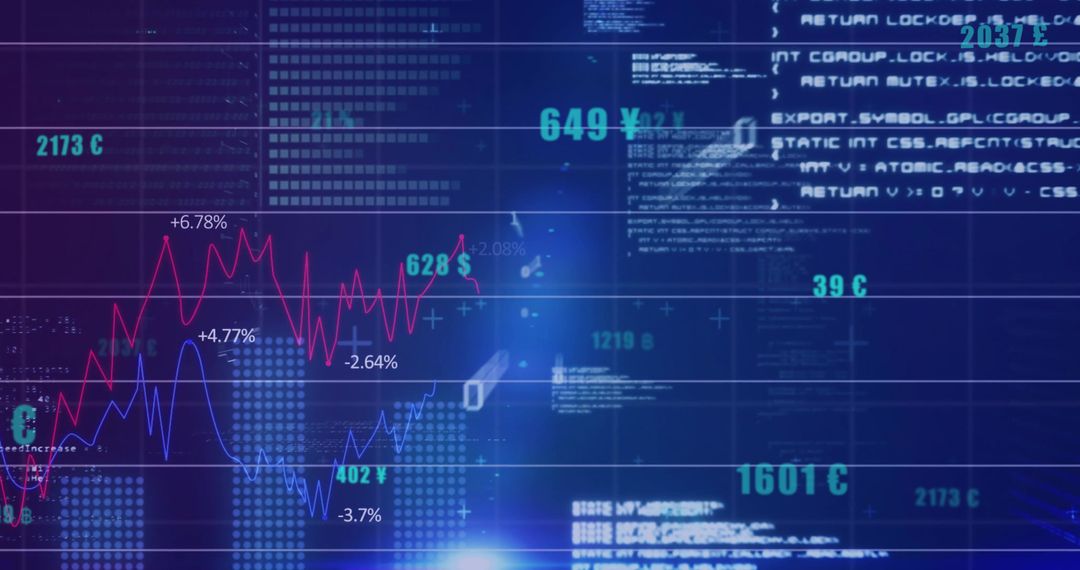
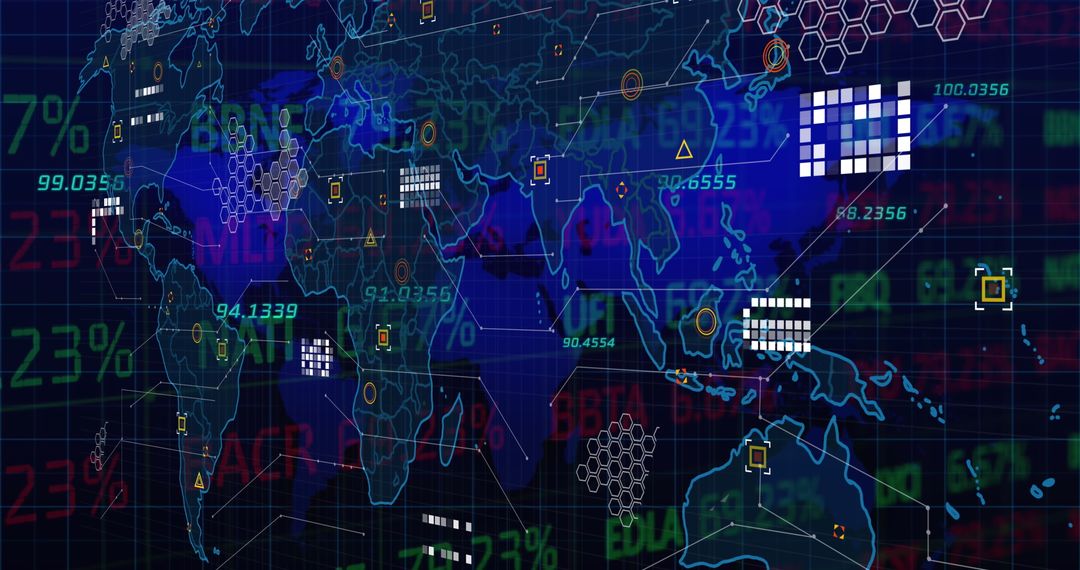
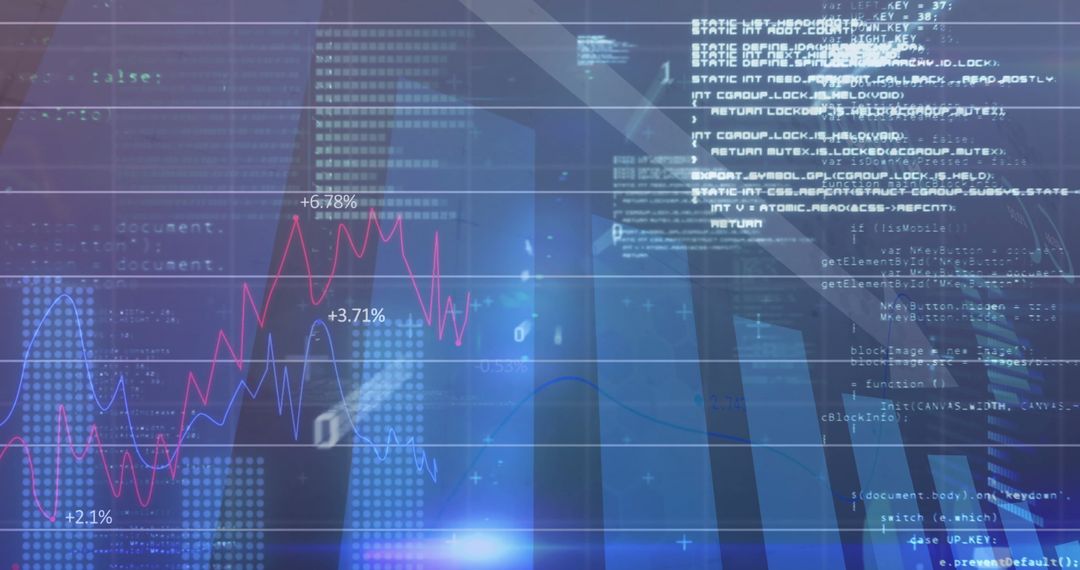
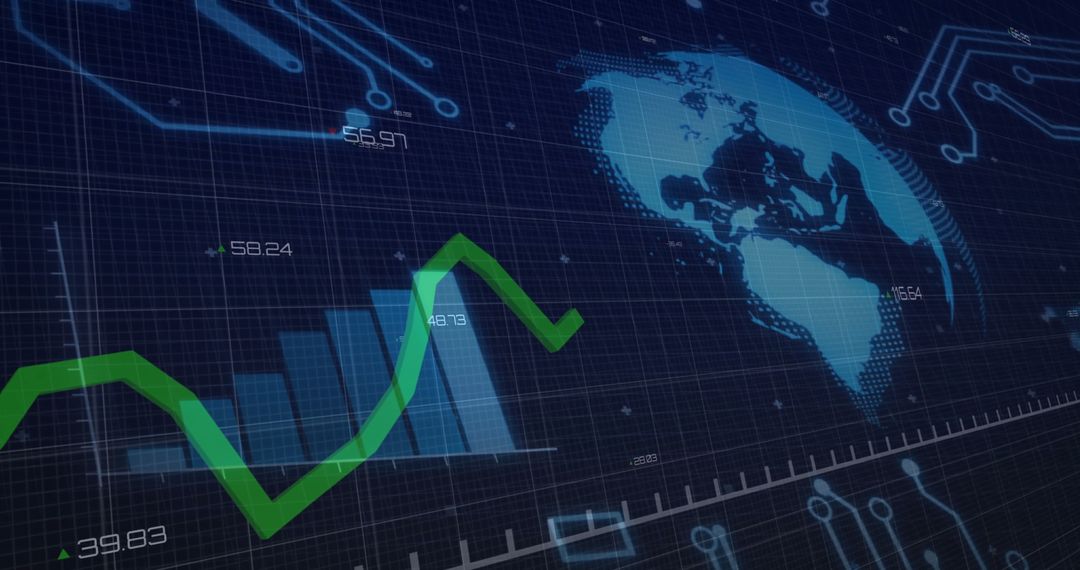
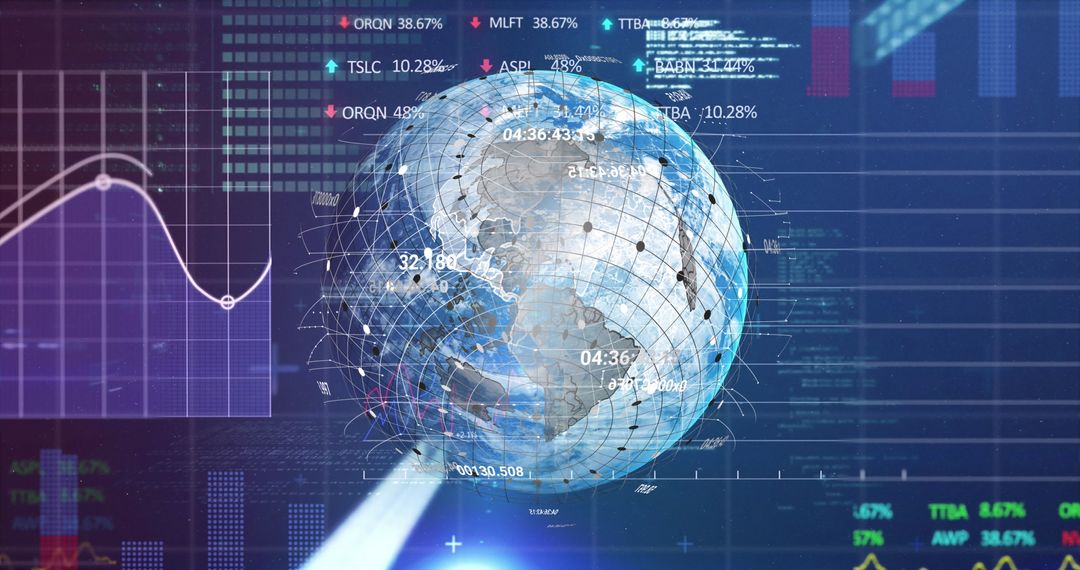
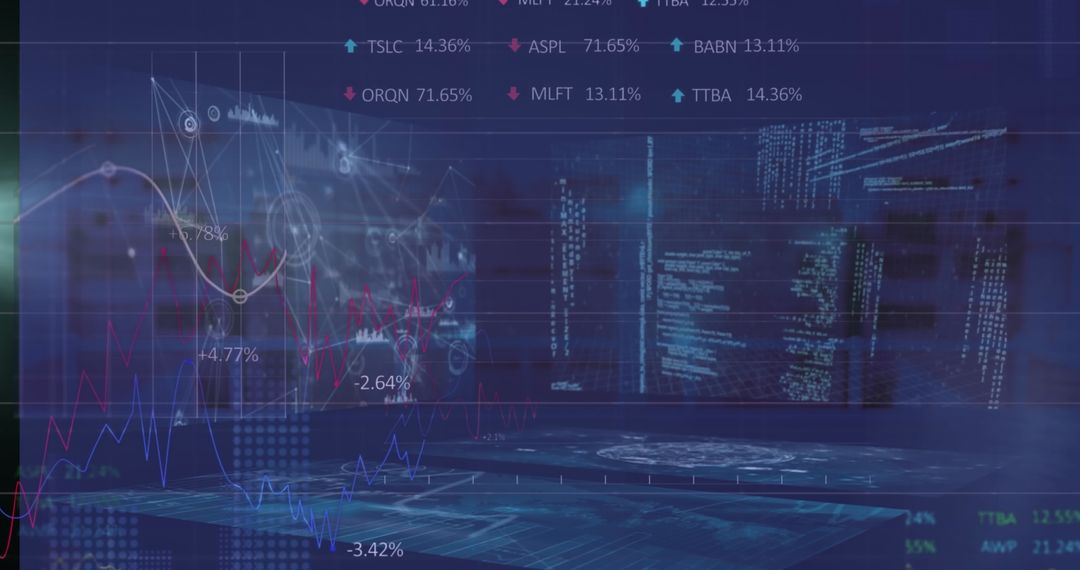
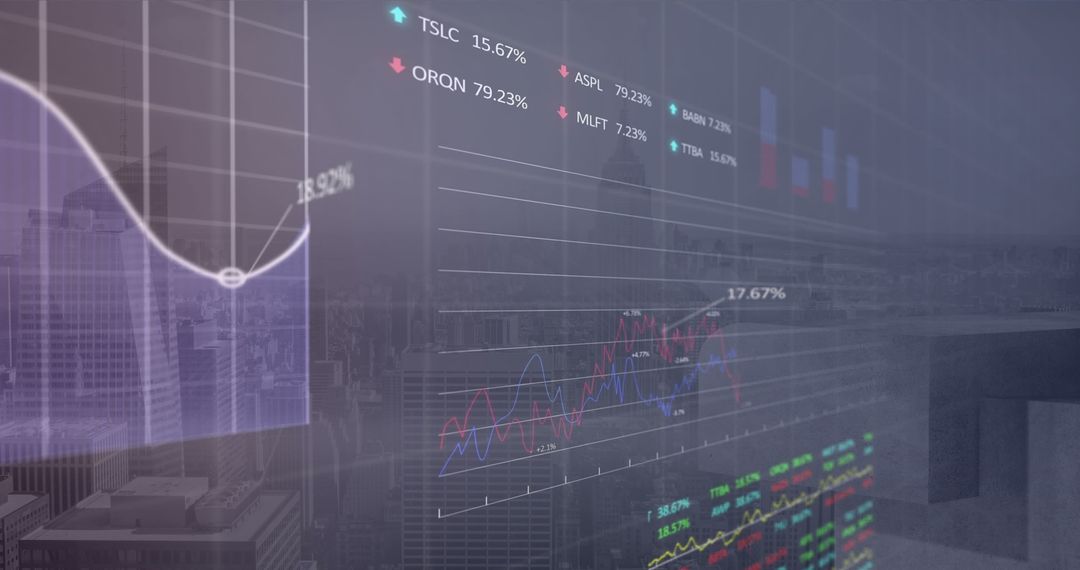
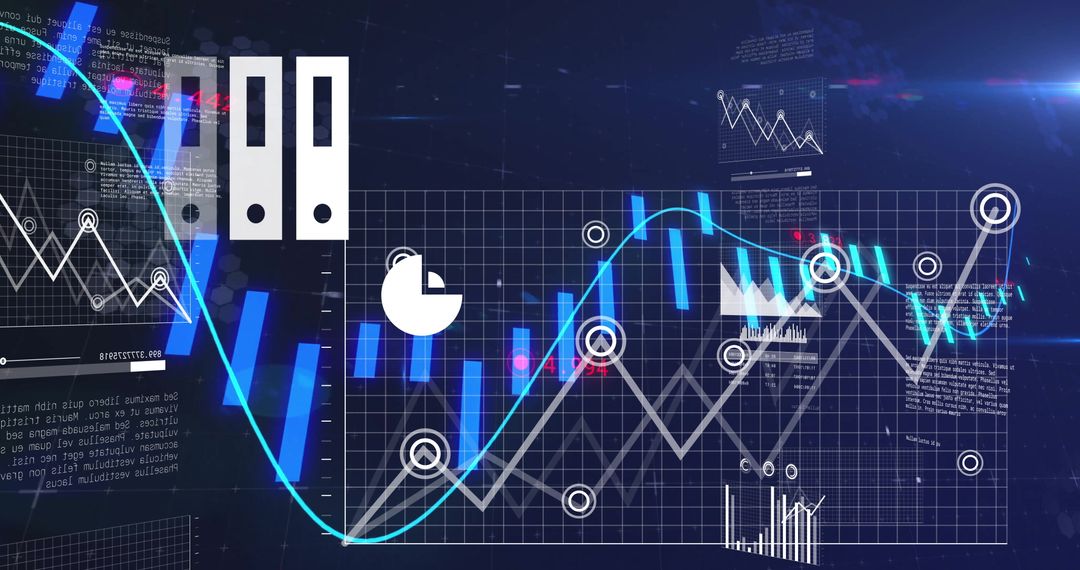
- Futuristic Financial Dashboard Showing Real-Time Market Data
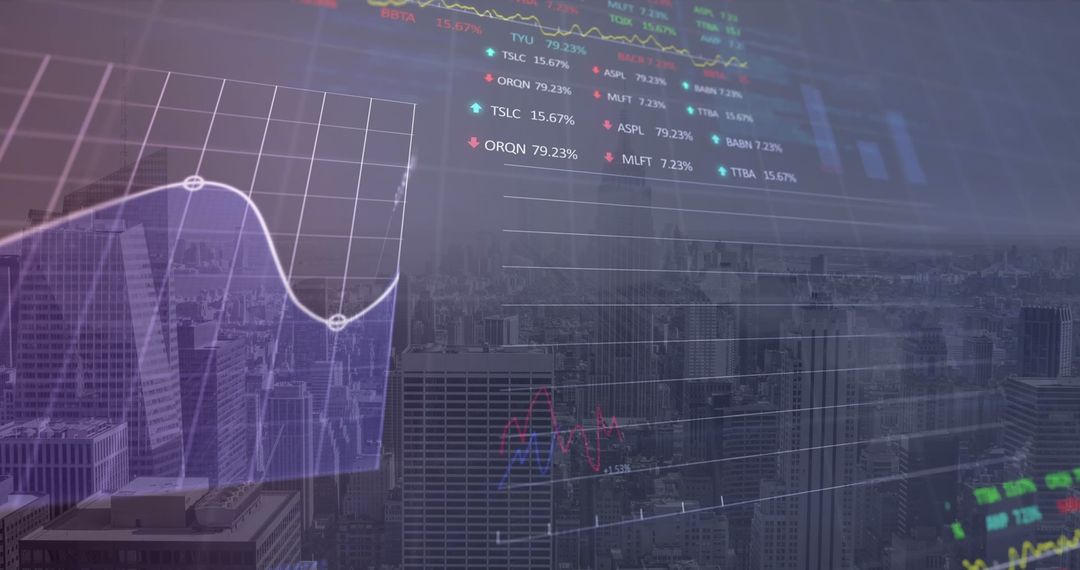
Futuristic Financial Dashboard Showing Real-Time Market Data Image
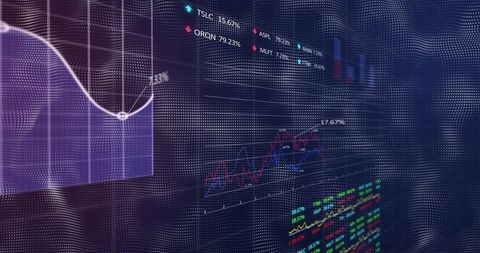
This image represents a high-tech financial dashboard displaying real-time stock market data, with vibrant, translucent charts and analytics. It could be used in financial and economic reports, presentations about investment strategies, fintech company branding materials, or digital tech reports highlighting advancements in real-time analytics and trading. Suitable for illustrating themes of innovation, data-driven decision making, and modern enterprise technology.
Powered by  - Get 15% off with code: PIKWIZARD15


0
downloads
downloads
Tags:
More
Credit Photo
If you would like to credit the Photo, here are some ways you can do so
Text Link
photo Link
<span class="text-link">
<span>
<a target="_blank" href=https://pikwizard.com/photo/futuristic-financial-dashboard-showing-real-time-market-data/5b7e14479e1ebcdec2b50c836a4016ba/>PikWizard</a>
</span>
</span>
<span class="image-link">
<span
style="margin: 0 0 20px 0; display: inline-block; vertical-align: middle; width: 100%;"
>
<a
target="_blank"
href="https://pikwizard.com/photo/futuristic-financial-dashboard-showing-real-time-market-data/5b7e14479e1ebcdec2b50c836a4016ba/"
style="text-decoration: none; font-size: 10px; margin: 0;"
>
<img src="https://pikwizard.com/pw/medium/5b7e14479e1ebcdec2b50c836a4016ba.jpg" style="margin: 0; width: 100%;" alt="" />
<p style="font-size: 12px; margin: 0;">PikWizard</p>
</a>
</span>
</span>
Free (free of charge)
Free for personal and commercial use.
Author: Creative Art
Similar Free Stock Images
Premium


Premium


Premium


Premium


Premium


Premium


Premium


Premium


Premium


Premium


Premium

Premium


Premium


Premium

Premium


Premium


Premium


Premium


Premium


Premium


Premium


Premium


Premium


Premium