- Home >
- Stock Photos >
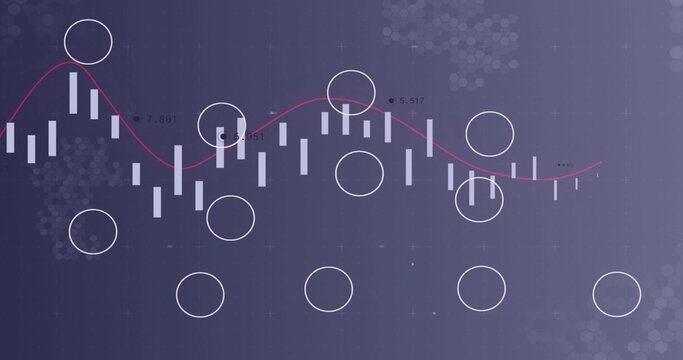
- Futuristic financial dashboard visualizing flowing trend lines and glowing market data
Futuristic financial dashboard visualizing flowing trend lines and glowing market data Image

Displaying futuristic trading interface with flowing curved trend lines, circular node markers, glowing tickers, and layered data overlays. Ideal for illustrating market analysis, algorithmic trading concepts, fintech presentations, and investment research materials. Working well as hero banner for finance websites, background for explainer videos, or slide visuals for investor pitches. Color scheme emphasizing blue and purple neon tones, conveying high-tech, data-driven atmosphere. Files suitable for widescreen layouts and headline compositions, and useful for editorial articles, social media campaigns, and product landing pages.
Powered by 


0
downloads
downloads
Tags:
More
Credit Photo
If you would like to credit the Photo, here are some ways you can do so
Text Link
photo Link
<span class="text-link">
<span>
<a target="_blank" href=https://pikwizard.com/photo/futuristic-financial-dashboard-visualizing-flowing-trend-lines-and-glowing-market-data/be7739067b994102ad2203f80fe833bd/>PikWizard</a>
</span>
</span>
<span class="image-link">
<span
style="margin: 0 0 20px 0; display: inline-block; vertical-align: middle; width: 100%;"
>
<a
target="_blank"
href="https://pikwizard.com/photo/futuristic-financial-dashboard-visualizing-flowing-trend-lines-and-glowing-market-data/be7739067b994102ad2203f80fe833bd/"
style="text-decoration: none; font-size: 10px; margin: 0;"
>
<img src="https://pikwizard.com/pw/medium/be7739067b994102ad2203f80fe833bd.jpg" style="margin: 0; width: 100%;" alt="" />
<p style="font-size: 12px; margin: 0;">PikWizard</p>
</a>
</span>
</span>
Free (free of charge)
Free for personal and commercial use.
Author: Creative Art
Similar Free Stock Images

Premium


Premium


Premium


Premium


Premium


Premium


Premium


Premium


Premium


Premium


Premium


Premium


Premium


Premium


Premium


Premium


Premium


Premium


Premium


Premium


Premium


Premium


Premium


Premium