- Home >
- Stock Photos >
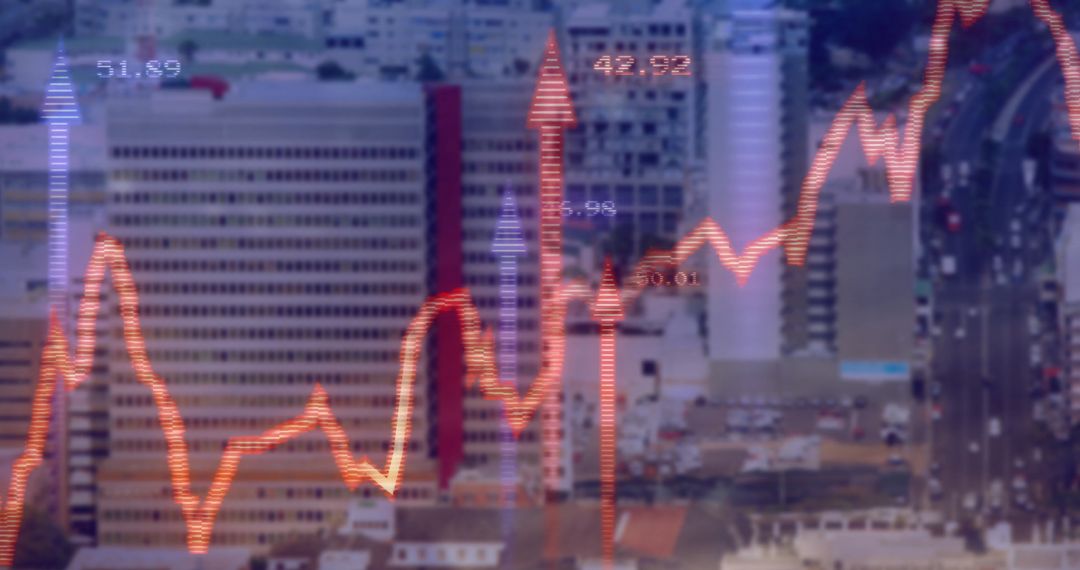
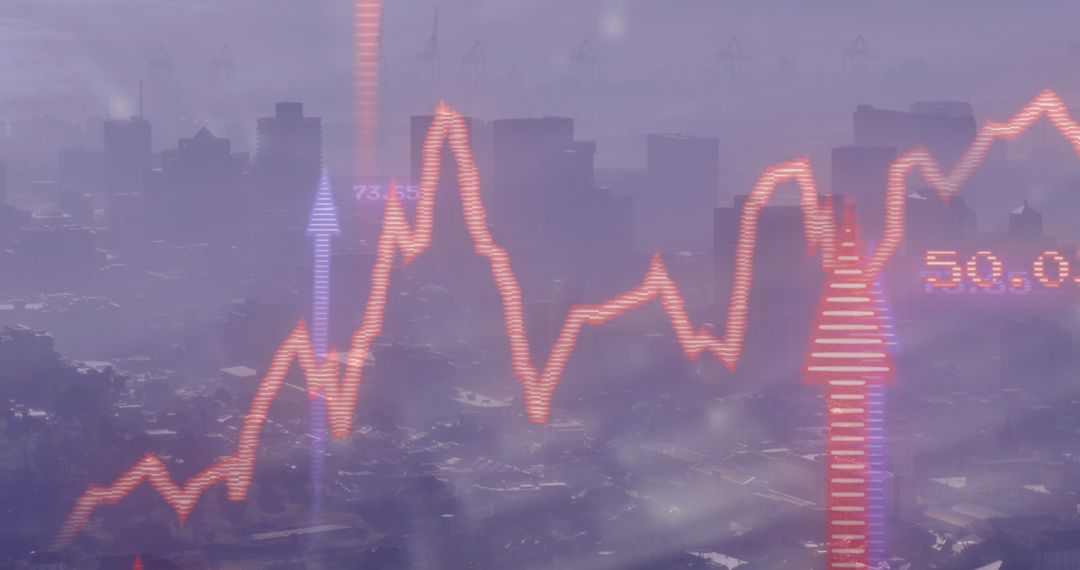
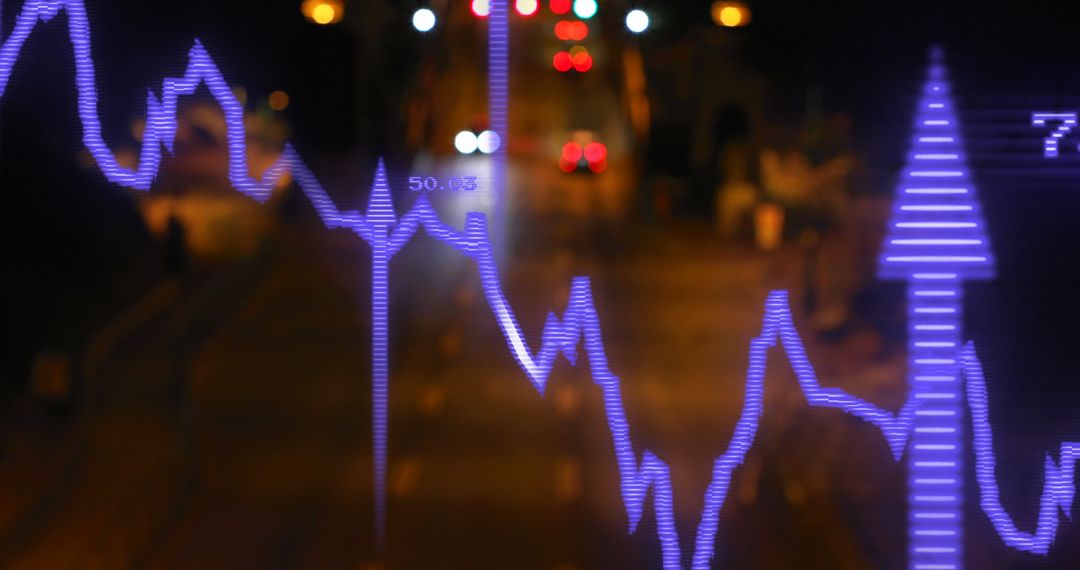
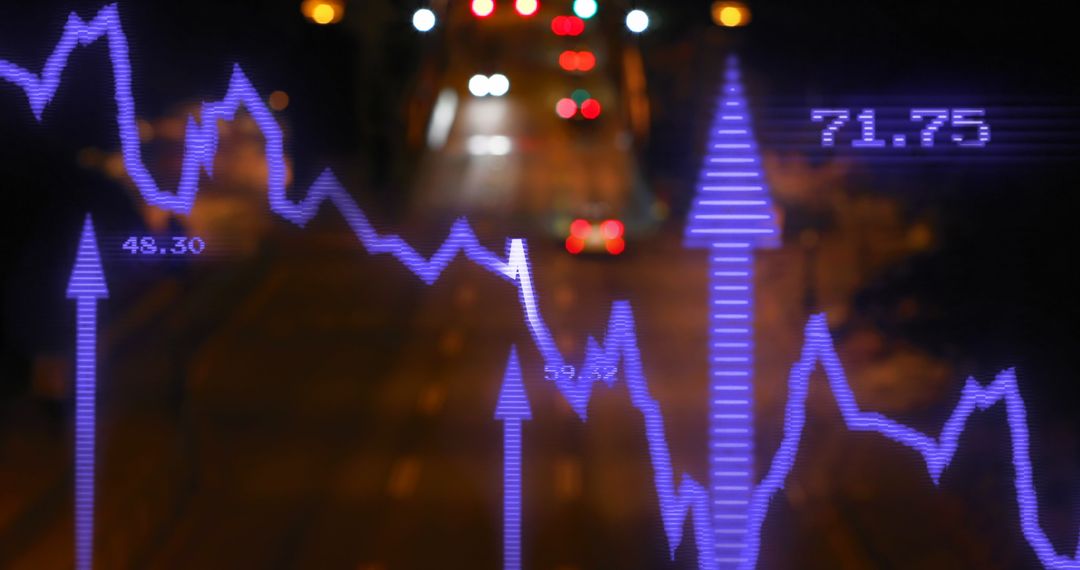
- Futuristic Financial Data Overlay on Nighttime Cityscape
Futuristic Financial Data Overlay on Nighttime Cityscape Image

Complex visual of financial data over a cityscape at night, featuring red line graph and purple bars. Useful for technology articles, blog posts, presentations on financial analytics, or advertisements for urban planning and futuristic technology endeavors.
Powered by  - Get 15% off with code: PIKWIZARD15


0
downloads
downloads
Tags:
More
Credit Photo
If you would like to credit the Photo, here are some ways you can do so
Text Link
photo Link
<span class="text-link">
<span>
<a target="_blank" href=https://pikwizard.com/photo/futuristic-financial-data-overlay-on-nighttime-cityscape/c438c56a97407d45324e25ae5d4f1d26/>PikWizard</a>
</span>
</span>
<span class="image-link">
<span
style="margin: 0 0 20px 0; display: inline-block; vertical-align: middle; width: 100%;"
>
<a
target="_blank"
href="https://pikwizard.com/photo/futuristic-financial-data-overlay-on-nighttime-cityscape/c438c56a97407d45324e25ae5d4f1d26/"
style="text-decoration: none; font-size: 10px; margin: 0;"
>
<img src="https://pikwizard.com/pw/medium/c438c56a97407d45324e25ae5d4f1d26.jpg" style="margin: 0; width: 100%;" alt="" />
<p style="font-size: 12px; margin: 0;">PikWizard</p>
</a>
</span>
</span>
Free (free of charge)
Free for personal and commercial use.
Author: Awesome Content
Similar Free Stock Images
Premium


Premium


Premium


Premium


Premium


Premium


Premium


Premium


Premium


Premium


Premium


Premium


Premium


Premium


Premium


Premium


Premium


Premium


Premium


Premium


Premium


Premium


Premium


Premium


Premium