- Home >
- Stock Photos >
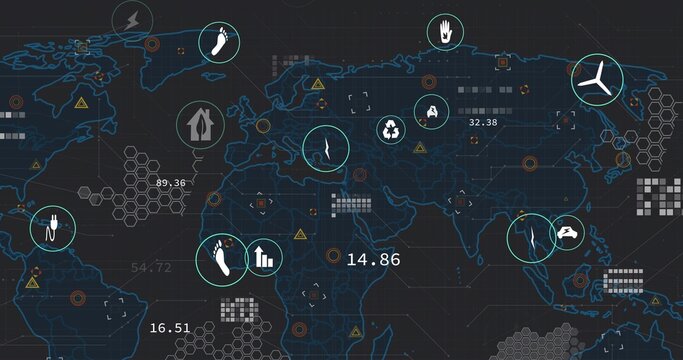
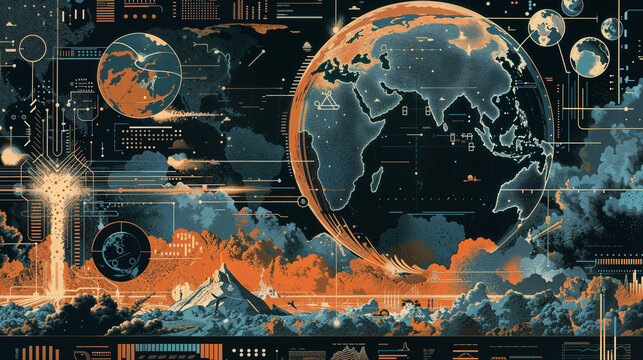
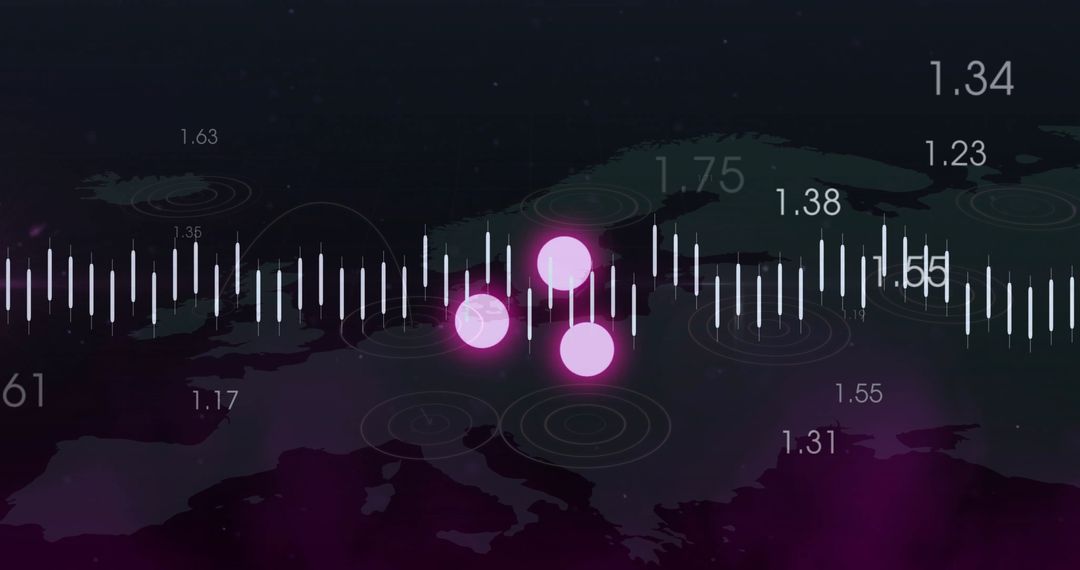
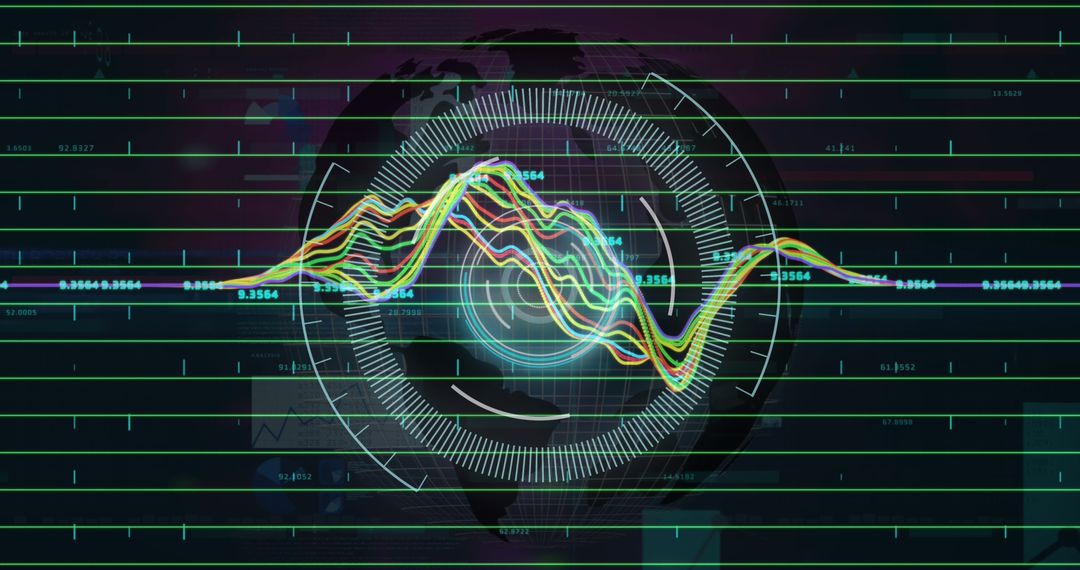
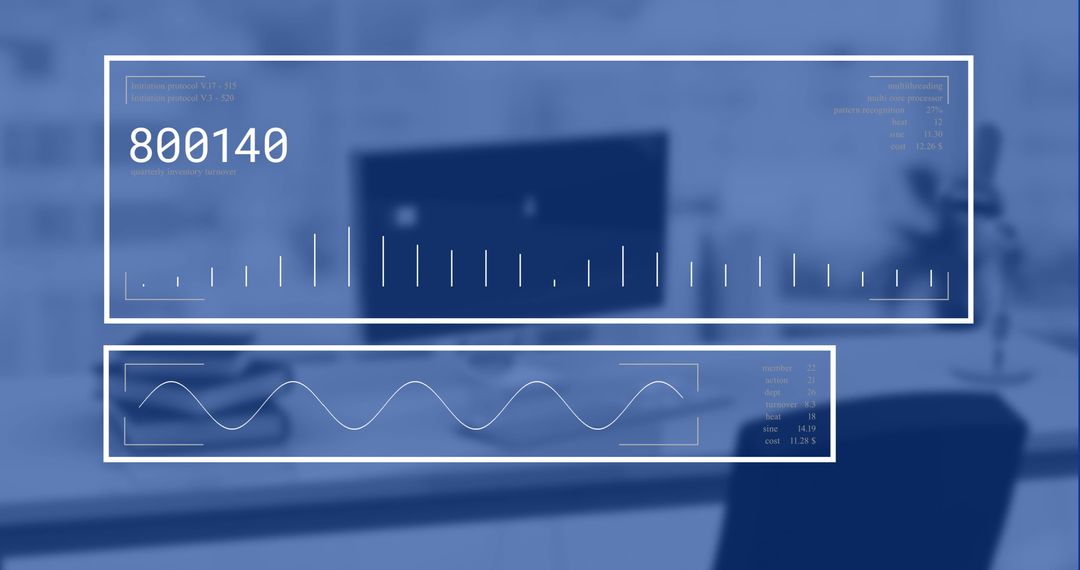
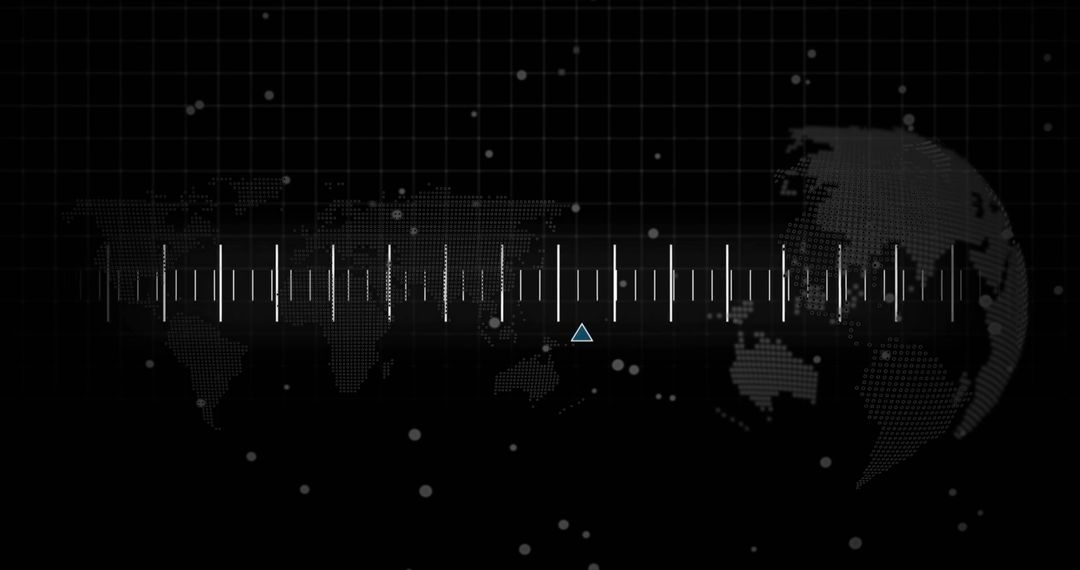
- Futuristic geospatial dashboard with glowing Australia, waveform and particle map overlay
Futuristic geospatial dashboard with glowing Australia, waveform and particle map overlay Image

Dark tech composition showing world map with hatched overlays, pulsing data particles, glowing Australia hotspot, and waveform across lower band. Vertical ruler on right edge and scattered colored points conveying real-time analytics and network signals. Visual using deep navy background with magenta and cyan accents for high-contrast futuristic look. Use cases: Serving as header visual for technology websites, supporting cybersecurity reports as background visual, enhancing slide decks for data analytics presentations, providing hero background for startup pitch decks, augmenting marketing materials for fintech and IoT products, illustrating editorial pieces on global connectivity and epidemic modeling. Design tips: Cropping central map area for wide banners, placing bold headline over dark left area for strong contrast, adding semi-transparent overlay behind text for readability, adjusting color balance to match brand palette, animating particles and waveform for motion graphics and video intros.
Powered by 


0
downloads
downloads
Tags:
More
Credit Photo
If you would like to credit the Photo, here are some ways you can do so
Text Link
photo Link
<span class="text-link">
<span>
<a target="_blank" href=https://pikwizard.com/photo/futuristic-geospatial-dashboard-with-glowing-australia-waveform-and-particle-map-overlay/00587046c9f893a391e2b276a5324ac0/>PikWizard</a>
</span>
</span>
<span class="image-link">
<span
style="margin: 0 0 20px 0; display: inline-block; vertical-align: middle; width: 100%;"
>
<a
target="_blank"
href="https://pikwizard.com/photo/futuristic-geospatial-dashboard-with-glowing-australia-waveform-and-particle-map-overlay/00587046c9f893a391e2b276a5324ac0/"
style="text-decoration: none; font-size: 10px; margin: 0;"
>
<img src="https://pikwizard.com/pw/medium/00587046c9f893a391e2b276a5324ac0.jpg" style="margin: 0; width: 100%;" alt="" />
<p style="font-size: 12px; margin: 0;">PikWizard</p>
</a>
</span>
</span>
Free (free of charge)
Free for personal and commercial use.
Author: People Creations
Similar Free Stock Images

Premium


Premium


Premium


Premium


Premium


Premium


Premium


Premium


Premium


Premium


Premium


Premium


Premium


Premium


Premium


Premium


Premium


Premium


Premium


Premium


Premium


Premium


Premium


Premium