
- Home >
- Stock Photos >
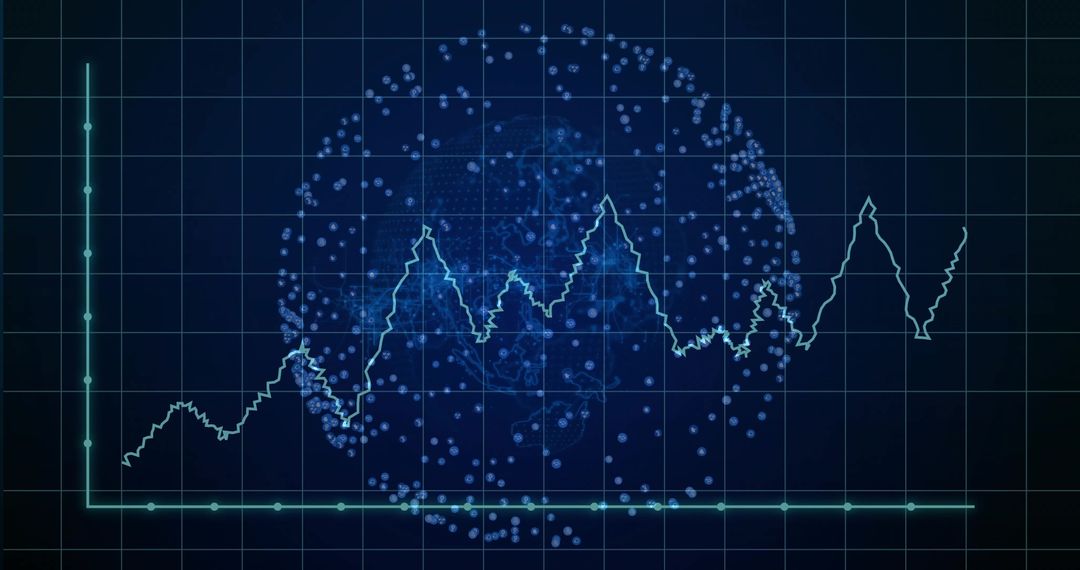
- Futuristic Global Finance Chart with Rotating Globe Animation
Futuristic Global Finance Chart with Rotating Globe Animation Image

Visually capturing futuristic theme with rotating globe and fluctuating graph showcasing global economic trends and financial analysis. Ideal for business presentations, financial reports, stock market reviews, and data-driven projects emphasizing global impact and technological advancement.
Powered by  - Get 15% off with code: PIKWIZARD15


2
downloads
downloads
Tags:
More
Credit Photo
If you would like to credit the Photo, here are some ways you can do so
Text Link
photo Link
<span class="text-link">
<span>
<a target="_blank" href=https://pikwizard.com/photo/futuristic-global-finance-chart-with-rotating-globe-animation/4c179cc4495e18361b71194c3a377f87/>PikWizard</a>
</span>
</span>
<span class="image-link">
<span
style="margin: 0 0 20px 0; display: inline-block; vertical-align: middle; width: 100%;"
>
<a
target="_blank"
href="https://pikwizard.com/photo/futuristic-global-finance-chart-with-rotating-globe-animation/4c179cc4495e18361b71194c3a377f87/"
style="text-decoration: none; font-size: 10px; margin: 0;"
>
<img src="https://pikwizard.com/pw/medium/4c179cc4495e18361b71194c3a377f87.jpg" style="margin: 0; width: 100%;" alt="" />
<p style="font-size: 12px; margin: 0;">PikWizard</p>
</a>
</span>
</span>
Free (free of charge)
Free for personal and commercial use.
Author: People Creations
Similar Free Stock Images

Premium


Premium


Premium


Premium


Premium


Premium


Premium


Premium


Premium


Premium


Premium


Premium


Premium


Premium


Premium


Premium


Premium


Premium


Premium


Premium


Premium


Premium


Premium


Premium

