- Home >
- Stock Photos >
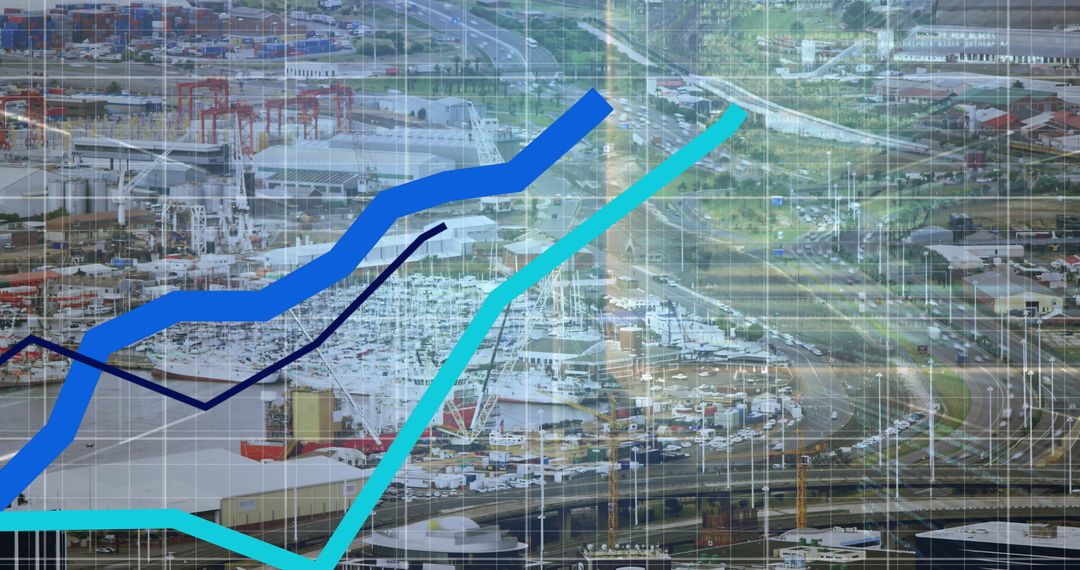
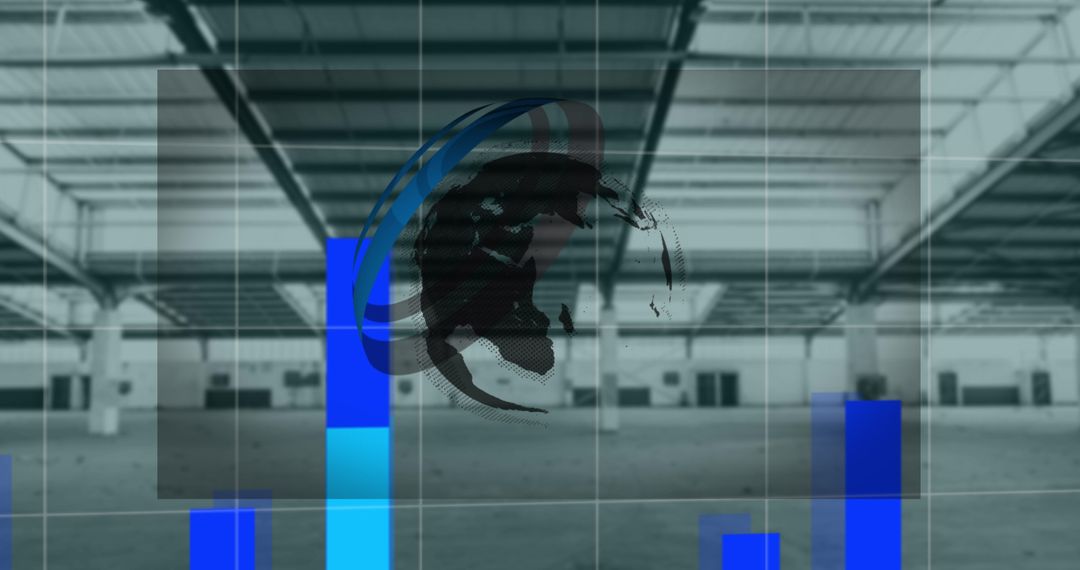
- Futuristic Graph Descending Through Floor Symbolizing Market Volatility
Futuristic Graph Descending Through Floor Symbolizing Market Volatility Image

Blue and cyan lines forming futuristic graph seemingly crashing through digital floor, representing market volatility or financial crisis. Can be used for illustrating economic articles, financial instability in technology sectors, or digital finance analysis concepts.
Powered by  - Get 15% off with code: PIKWIZARD15


2
downloads
downloads
Tags:
More
Credit Photo
If you would like to credit the Photo, here are some ways you can do so
Text Link
photo Link
<span class="text-link">
<span>
<a target="_blank" href=https://pikwizard.com/photo/futuristic-graph-descending-through-floor-symbolizing-market-volatility/77e3c21fe607853c82dacdce6fbf83e6/>PikWizard</a>
</span>
</span>
<span class="image-link">
<span
style="margin: 0 0 20px 0; display: inline-block; vertical-align: middle; width: 100%;"
>
<a
target="_blank"
href="https://pikwizard.com/photo/futuristic-graph-descending-through-floor-symbolizing-market-volatility/77e3c21fe607853c82dacdce6fbf83e6/"
style="text-decoration: none; font-size: 10px; margin: 0;"
>
<img src="https://pikwizard.com/pw/medium/77e3c21fe607853c82dacdce6fbf83e6.jpg" style="margin: 0; width: 100%;" alt="" />
<p style="font-size: 12px; margin: 0;">PikWizard</p>
</a>
</span>
</span>
Free (free of charge)
Free for personal and commercial use.
Author: Awesome Content
Similar Free Stock Images

Premium


Premium


Premium


Premium


Premium


Premium


Premium


Premium


Premium


Premium


Premium


Premium


Premium


Premium


Premium


Premium


Premium


Premium


Premium


Premium


Premium


Premium


Premium


Premium