- Home >
- Stock Photos >
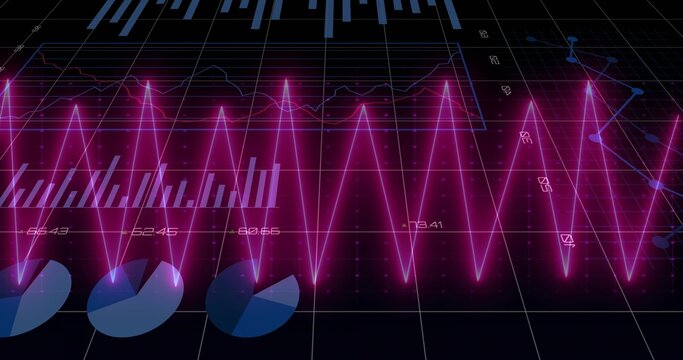
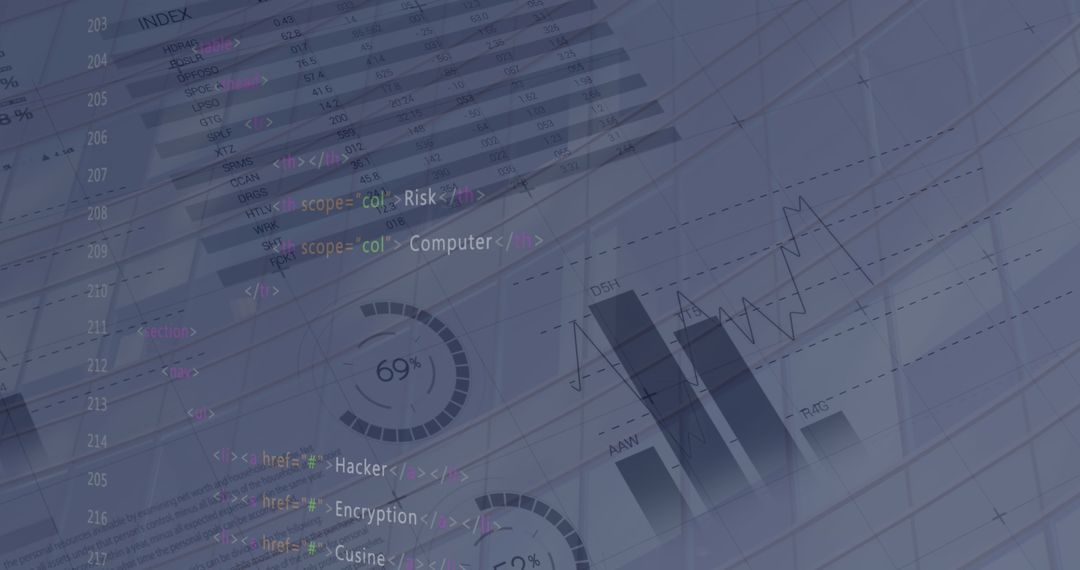
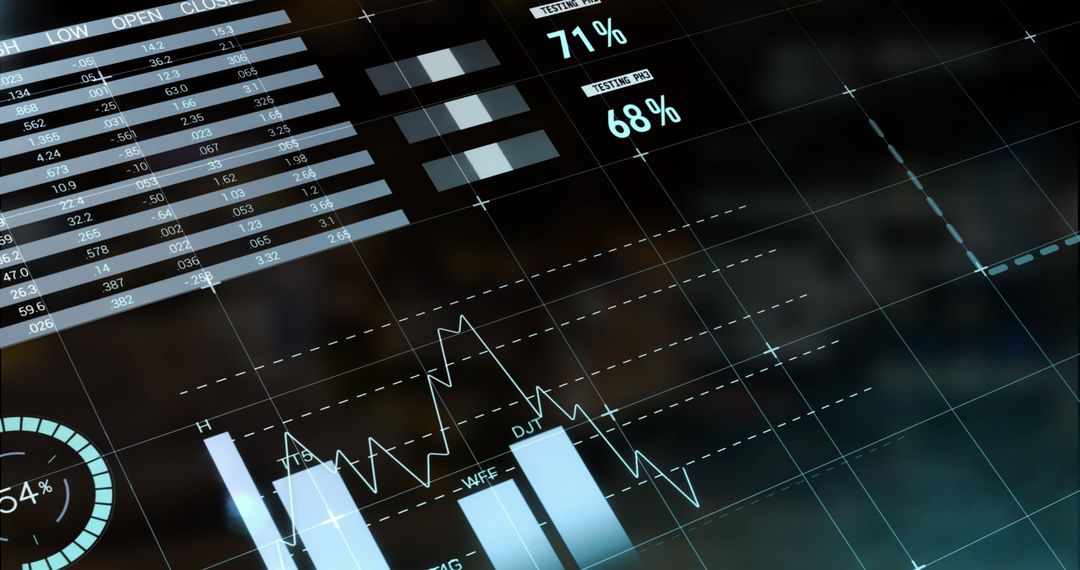
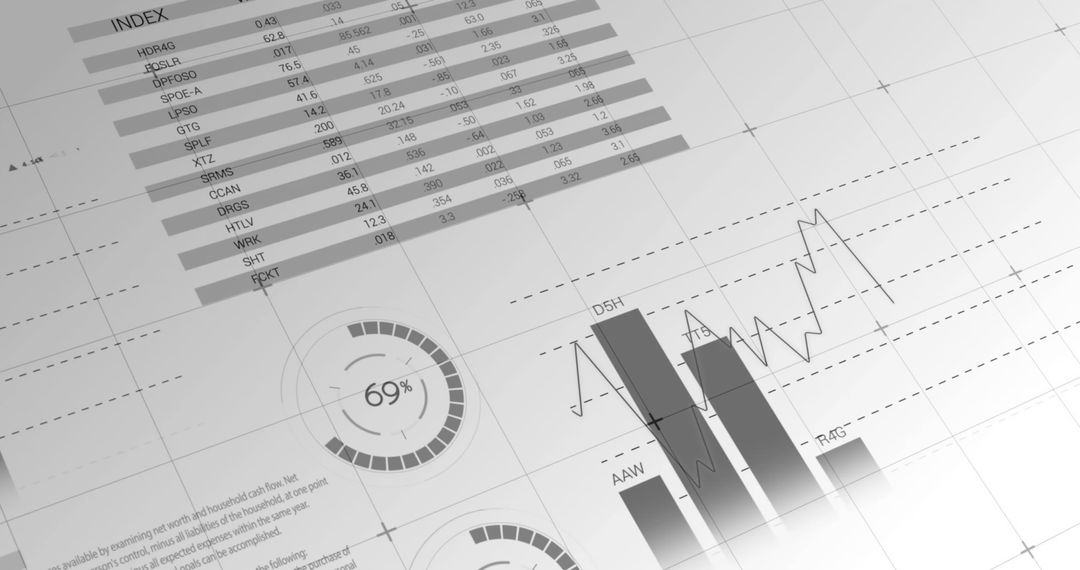
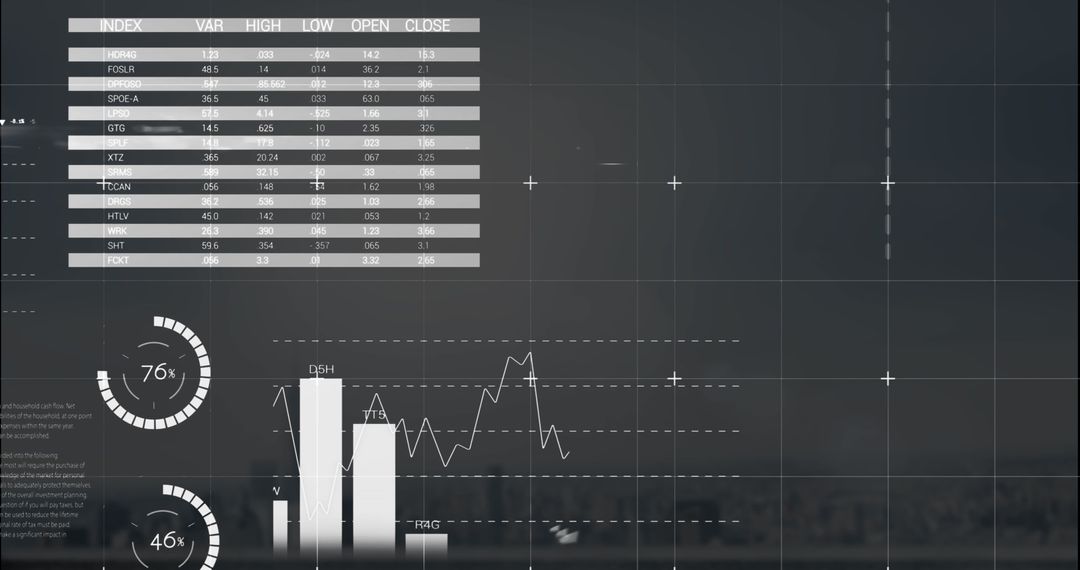
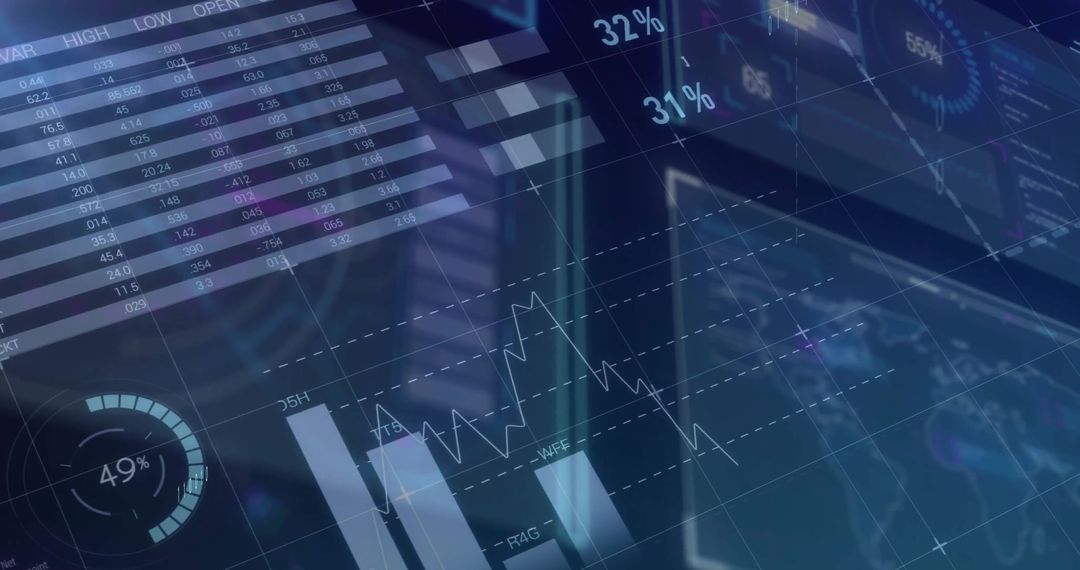
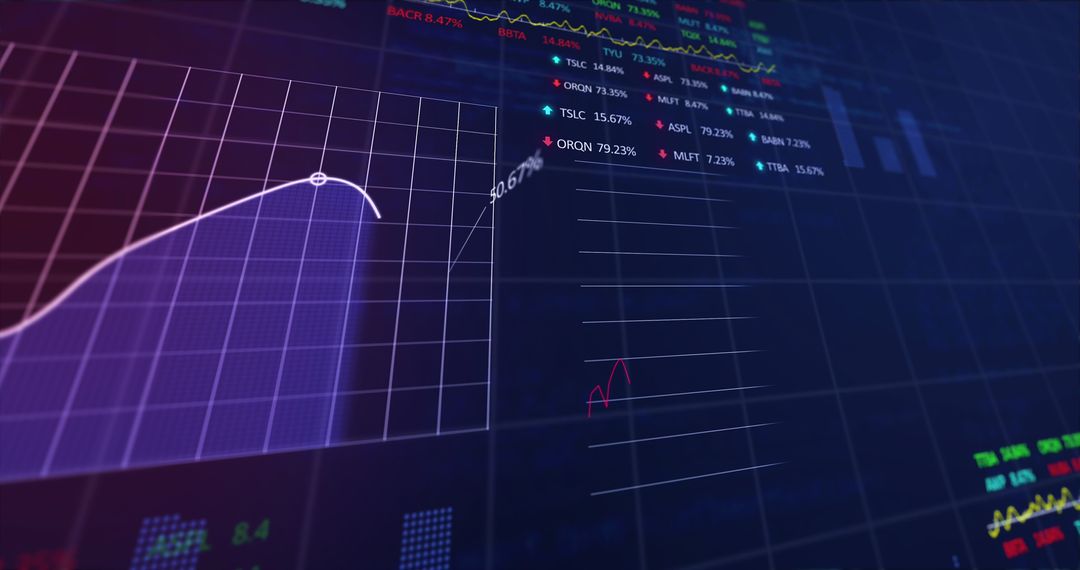
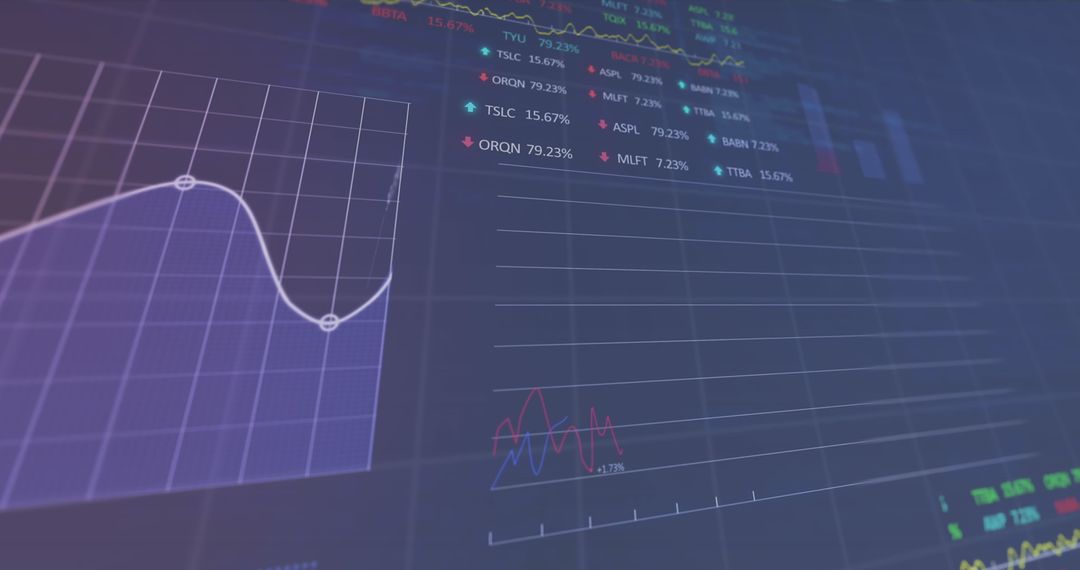
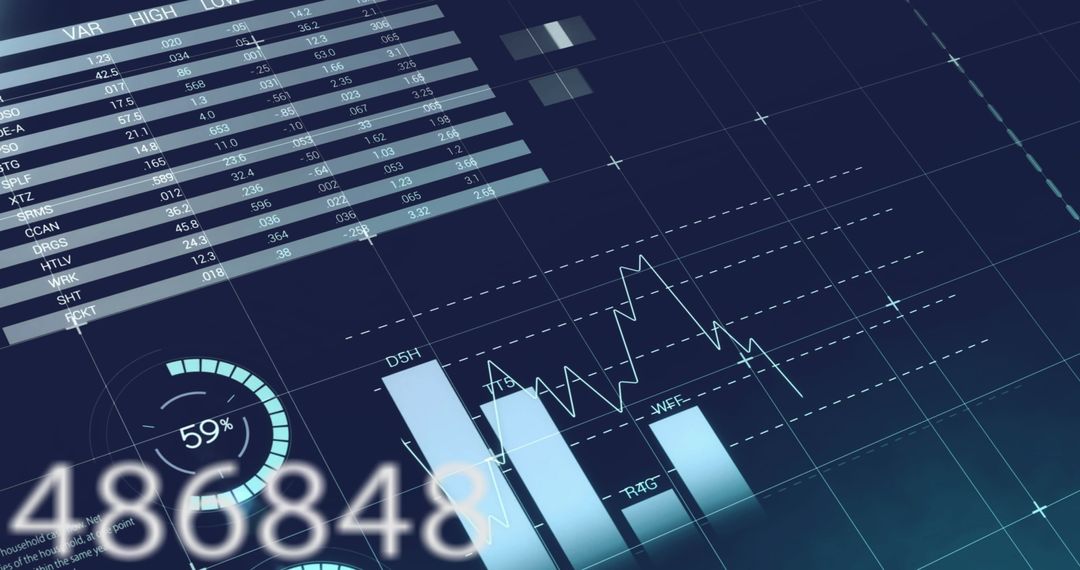
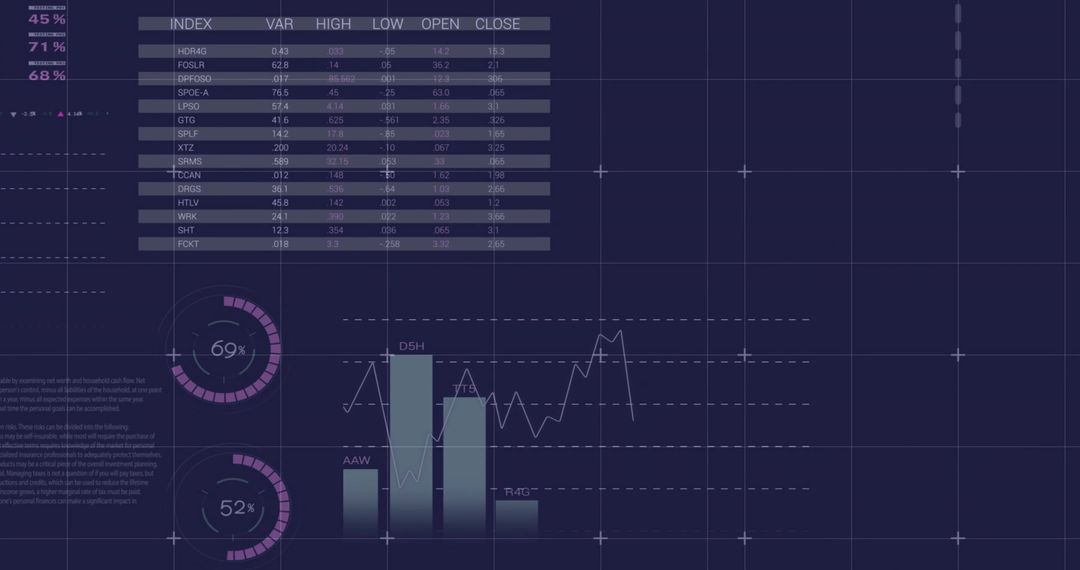
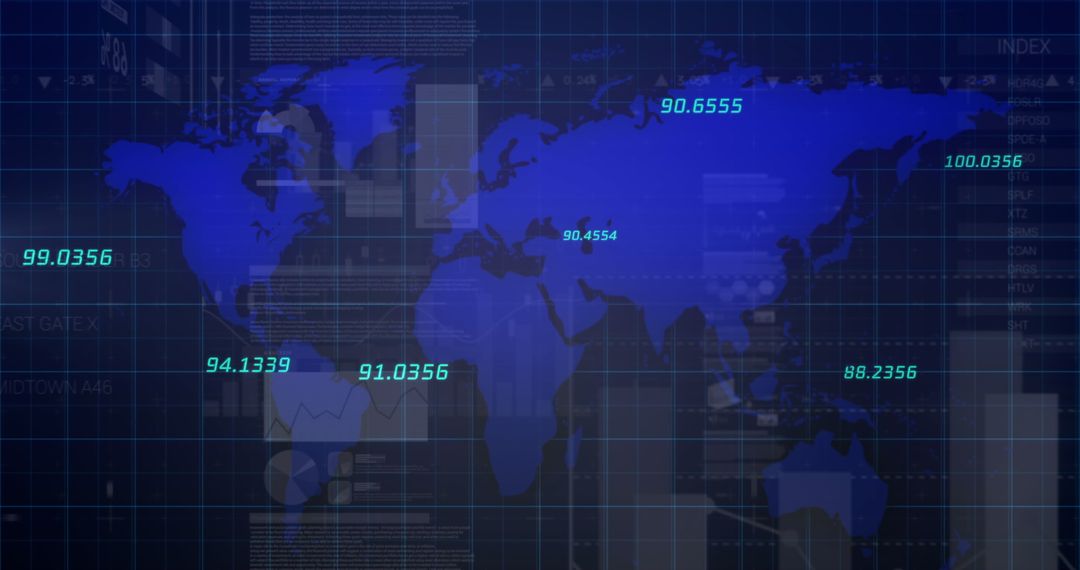
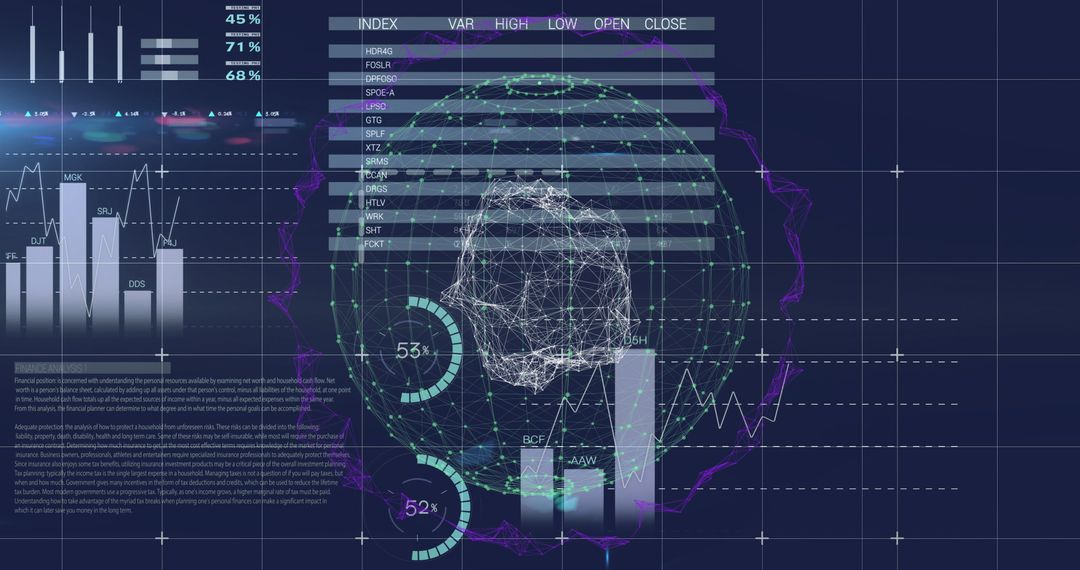
- Futuristic holographic analytics dashboard floating over grid with line graph and bar chart
Futuristic holographic analytics dashboard floating over grid with line graph and bar chart Image

Showing translucent holographic dashboard hovering above dark grid plane, containing line chart tracking trend and stacked bar chart comparing metrics. Featuring semi-transparent numeric table, circular progress meters, and subtle crosshair grid for technical look. Using cool blue palette and low-contrast overlays for modern professional atmosphere. Working well for fintech designs, SaaS landing pages, investor pitch decks, business intelligence presentations, technology blogs, corporate reports, and broadcast graphics. Pairing easily with overlaying headline text, icons, logo, or animated motion graphics for video. Providing abstract high-tech backdrop for concepts such as data analytics, financial forecasting, performance monitoring, and UI/UX mockups.
Powered by 


0
downloads
downloads
Tags:
More
Credit Photo
If you would like to credit the Photo, here are some ways you can do so
Text Link
photo Link
<span class="text-link">
<span>
<a target="_blank" href=https://pikwizard.com/photo/futuristic-holographic-analytics-dashboard-floating-over-grid-with-line-graph-and-bar-chart/88125f2c496f5a1f51917116f87b823a/>PikWizard</a>
</span>
</span>
<span class="image-link">
<span
style="margin: 0 0 20px 0; display: inline-block; vertical-align: middle; width: 100%;"
>
<a
target="_blank"
href="https://pikwizard.com/photo/futuristic-holographic-analytics-dashboard-floating-over-grid-with-line-graph-and-bar-chart/88125f2c496f5a1f51917116f87b823a/"
style="text-decoration: none; font-size: 10px; margin: 0;"
>
<img src="https://pikwizard.com/pw/medium/88125f2c496f5a1f51917116f87b823a.jpg" style="margin: 0; width: 100%;" alt="" />
<p style="font-size: 12px; margin: 0;">PikWizard</p>
</a>
</span>
</span>
Free (free of charge)
Free for personal and commercial use.
Author: Awesome Content
Similar Free Stock Images

Premium


Premium


Premium


Premium


Premium


Premium


Premium


Premium


Premium

Premium


Premium


Premium


Premium


Premium


Premium


Premium


Premium


Premium


Premium


Premium


Premium


Premium


Premium

Premium