- Home >
- Stock Photos >
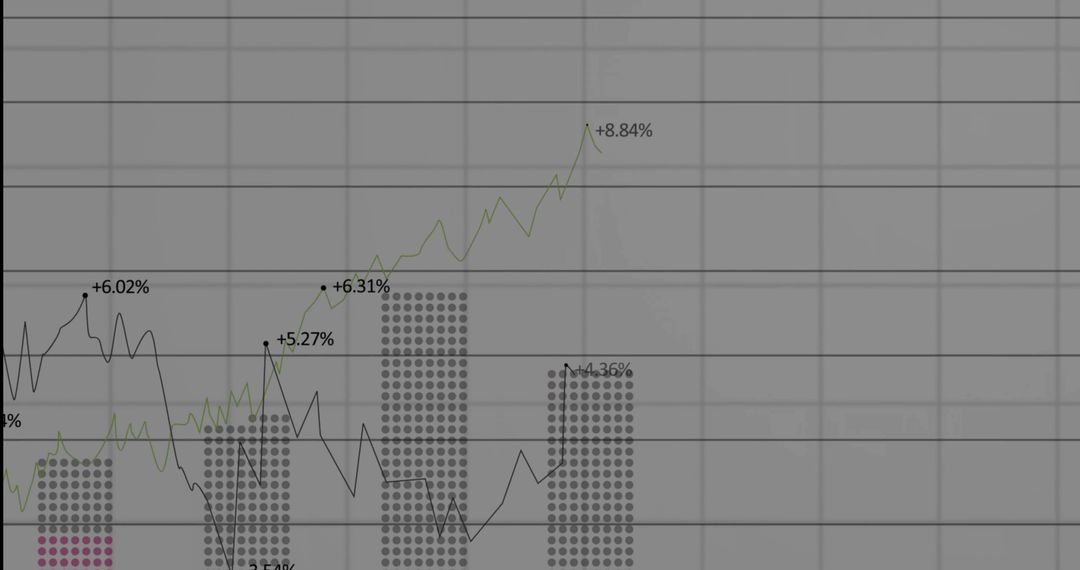
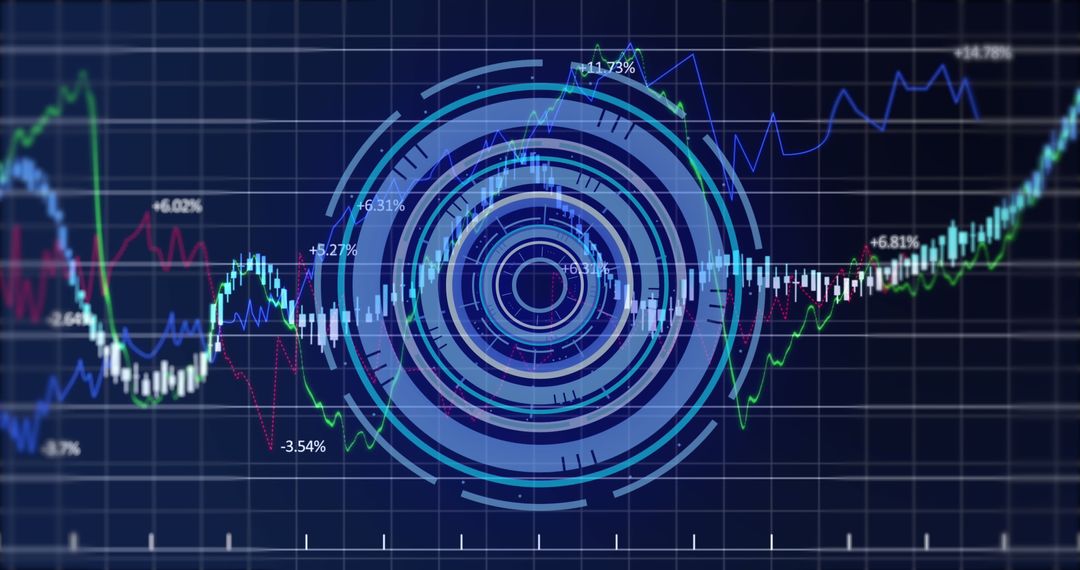
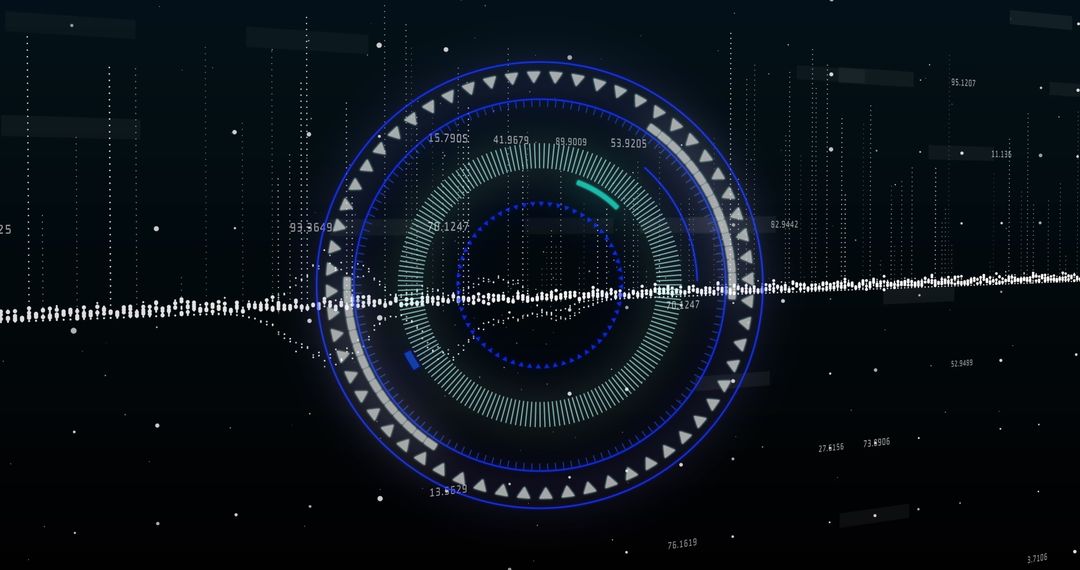
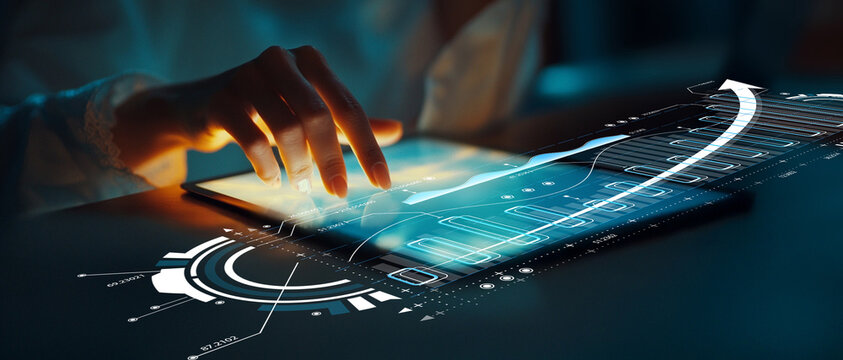
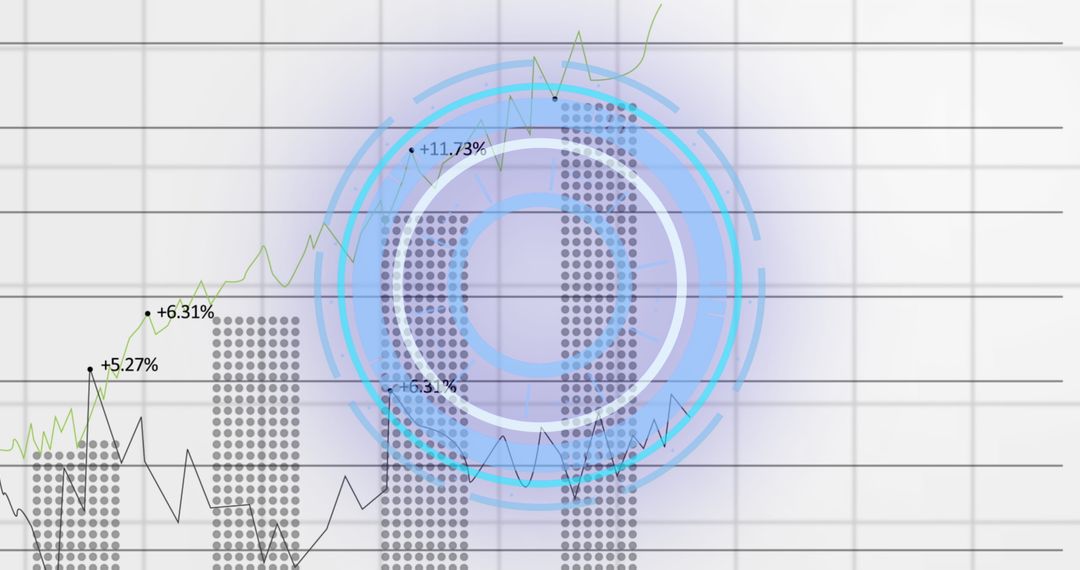
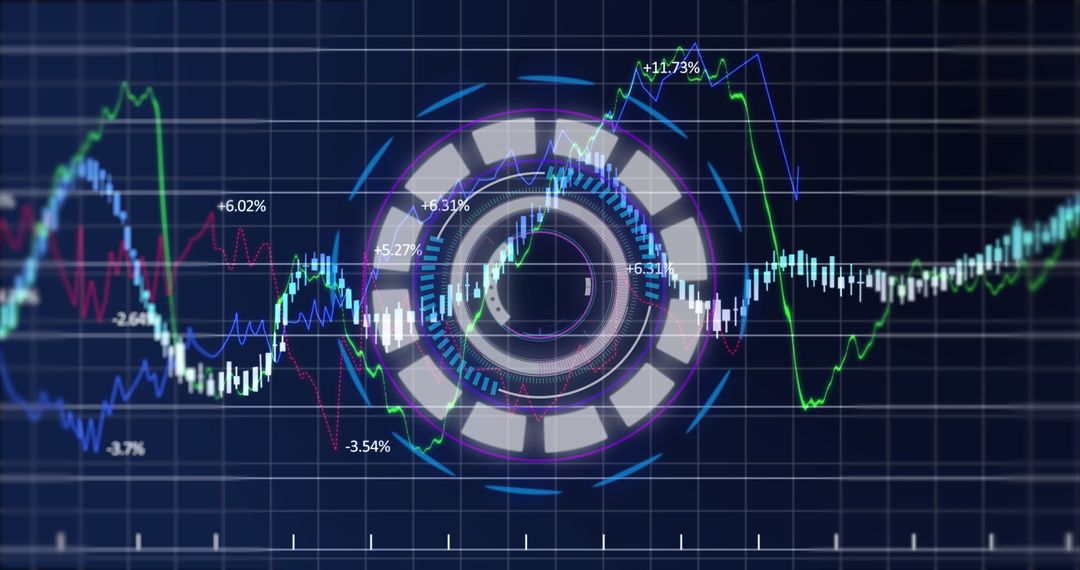
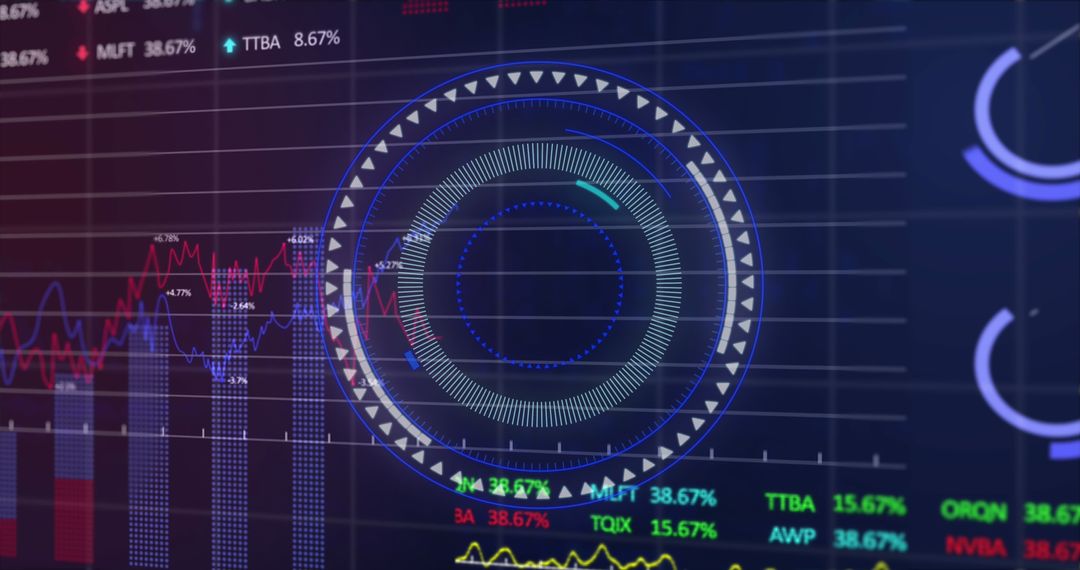
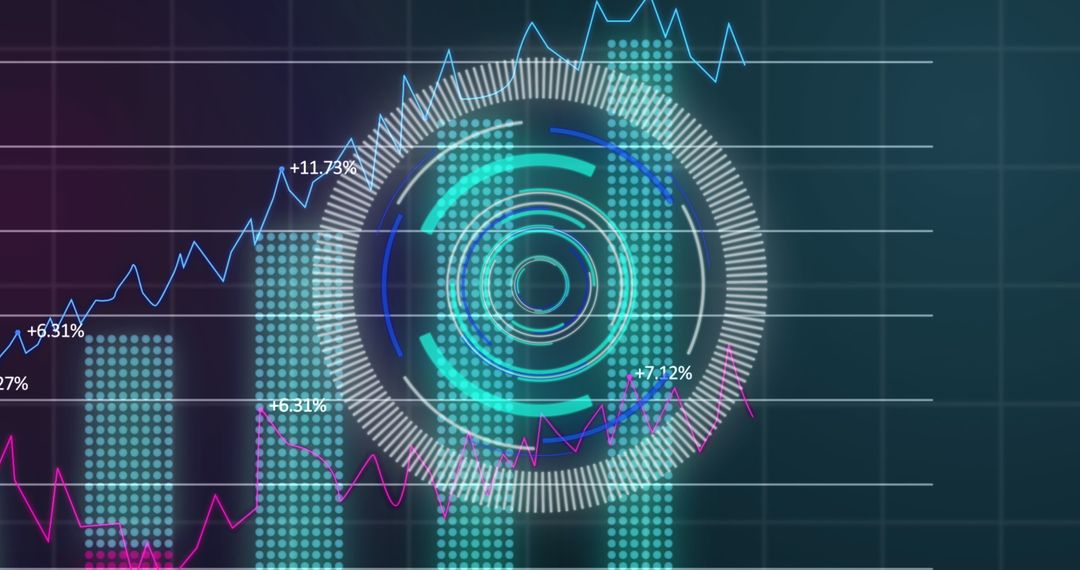
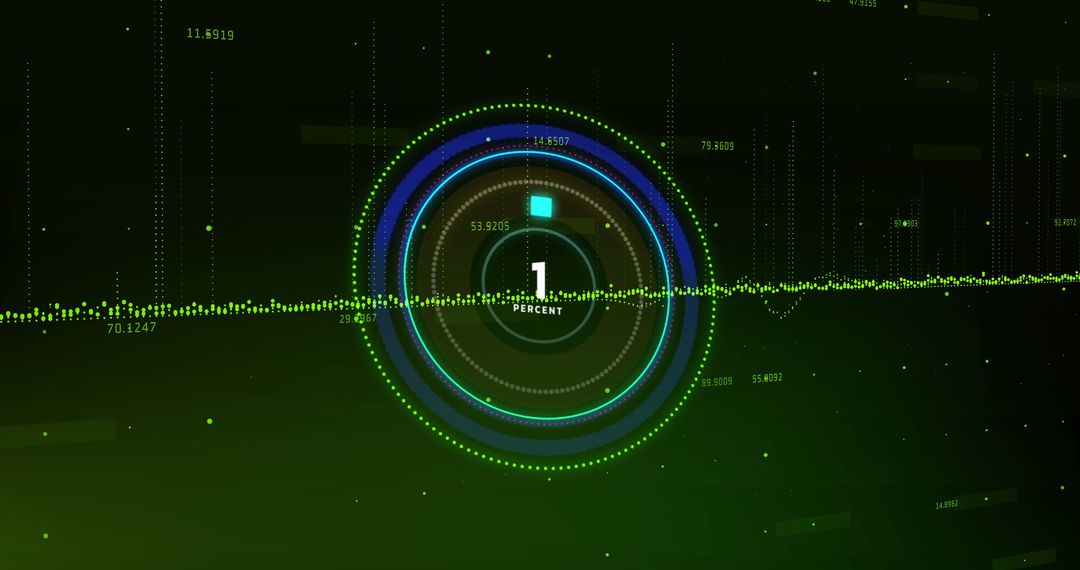
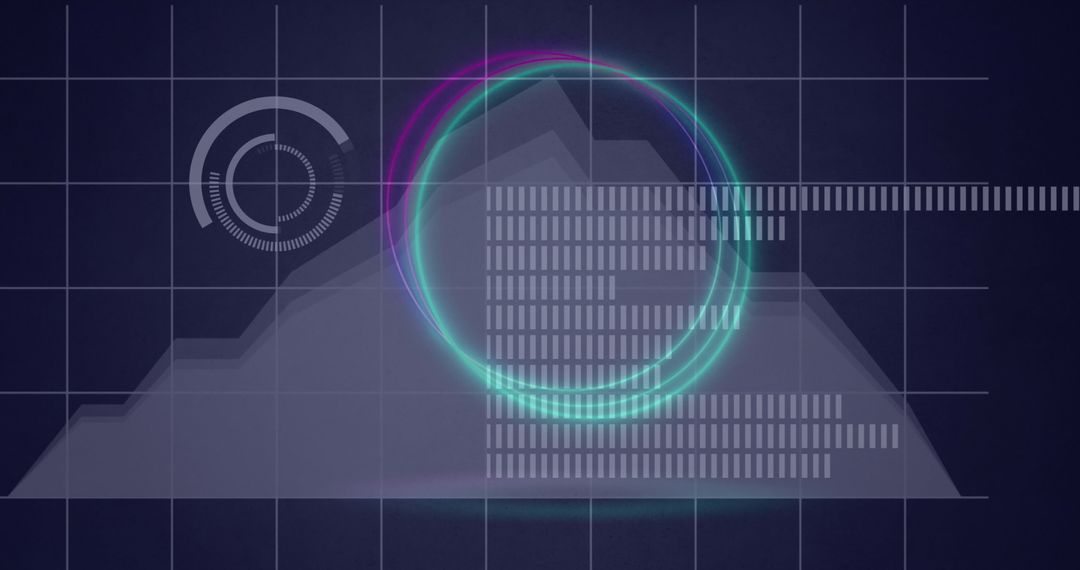
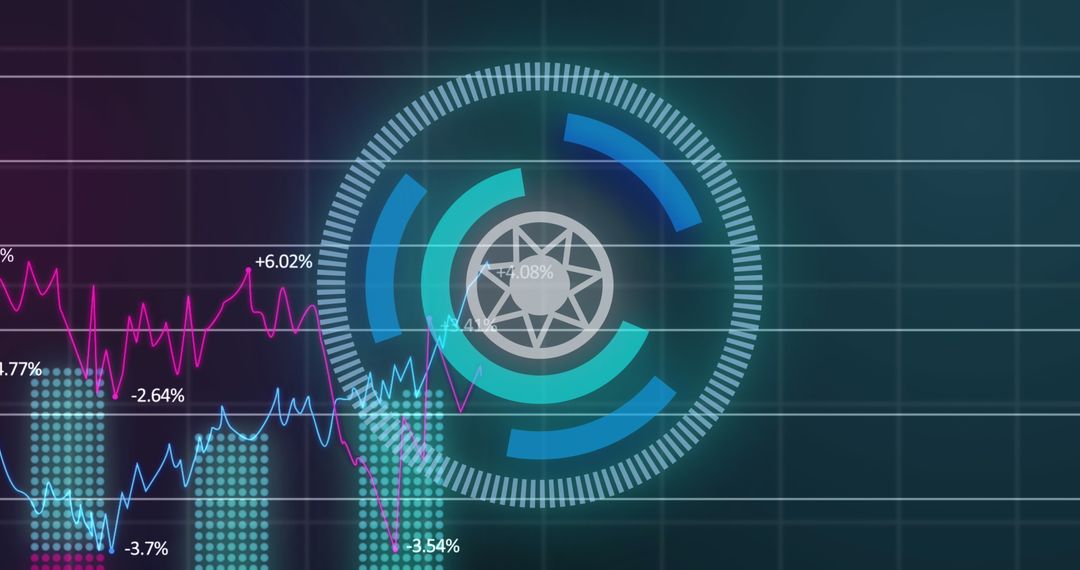
- Futuristic Interface with Data Trends and Diverging Charts
Futuristic Interface with Data Trends and Diverging Charts Image
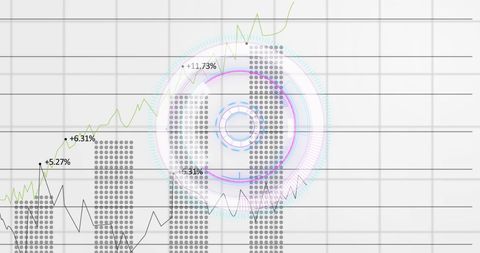
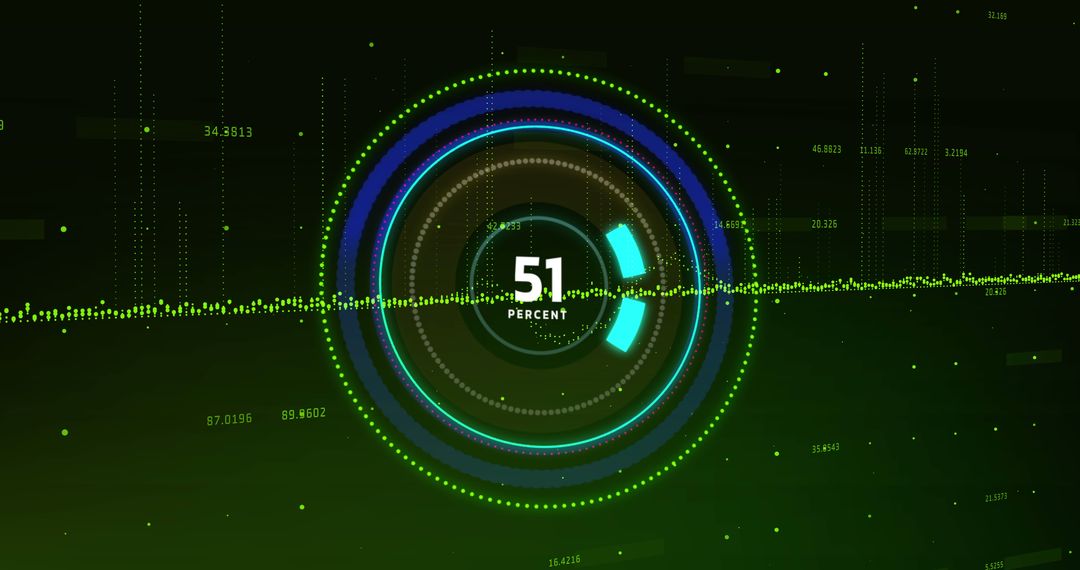
This digital illustration showcases a futuristic interface overlaying business data statistics. The visual contains a graph highlighting numerical data alongside a round digital scanner, emphasizing technological sophistication in data analysis. This image is ideal for use in business presentations, technological articles, financial reports, and content focused on data analytics and technology trends.
Powered by 


2
downloads
downloads
Tags:
More
Credit Photo
If you would like to credit the Photo, here are some ways you can do so
Text Link
photo Link
<span class="text-link">
<span>
<a target="_blank" href=https://pikwizard.com/photo/futuristic-interface-with-data-trends-and-diverging-charts/29109bab9c587b392b42211d1432a177/>PikWizard</a>
</span>
</span>
<span class="image-link">
<span
style="margin: 0 0 20px 0; display: inline-block; vertical-align: middle; width: 100%;"
>
<a
target="_blank"
href="https://pikwizard.com/photo/futuristic-interface-with-data-trends-and-diverging-charts/29109bab9c587b392b42211d1432a177/"
style="text-decoration: none; font-size: 10px; margin: 0;"
>
<img src="https://pikwizard.com/pw/medium/29109bab9c587b392b42211d1432a177.jpg" style="margin: 0; width: 100%;" alt="" />
<p style="font-size: 12px; margin: 0;">PikWizard</p>
</a>
</span>
</span>
Free (free of charge)
Free for personal and commercial use.
Author: Creative Art
Similar Free Stock Images

Premium


Premium


Premium
Premium

Premium


Premium


Premium


Premium


Premium


Premium


Premium


Premium


Premium


Premium


Premium


Premium


Premium


Premium


Premium


Premium
Premium


Premium


Premium

Premium