- Home >
- Stock Photos >
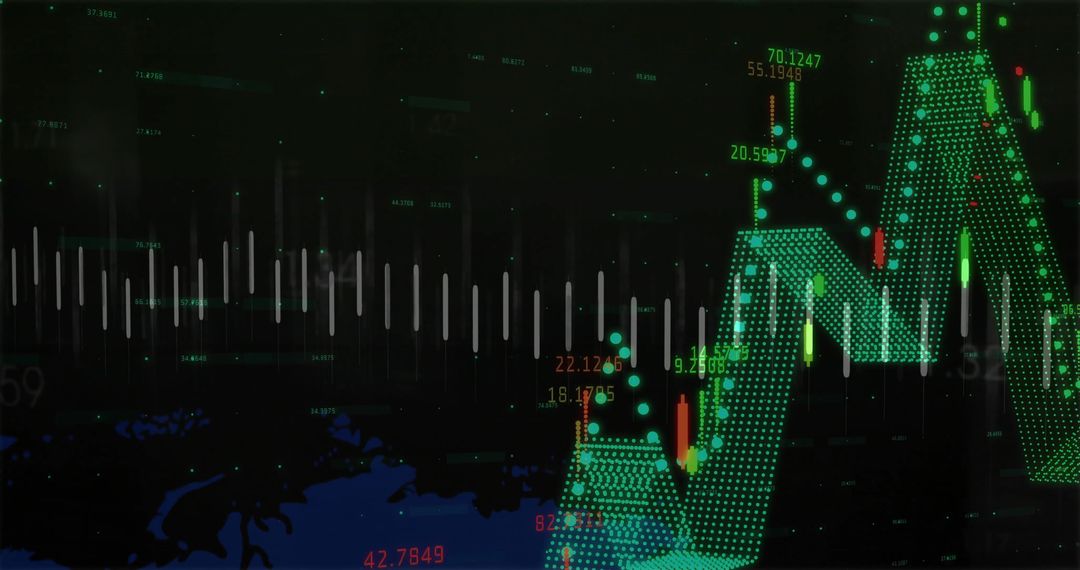
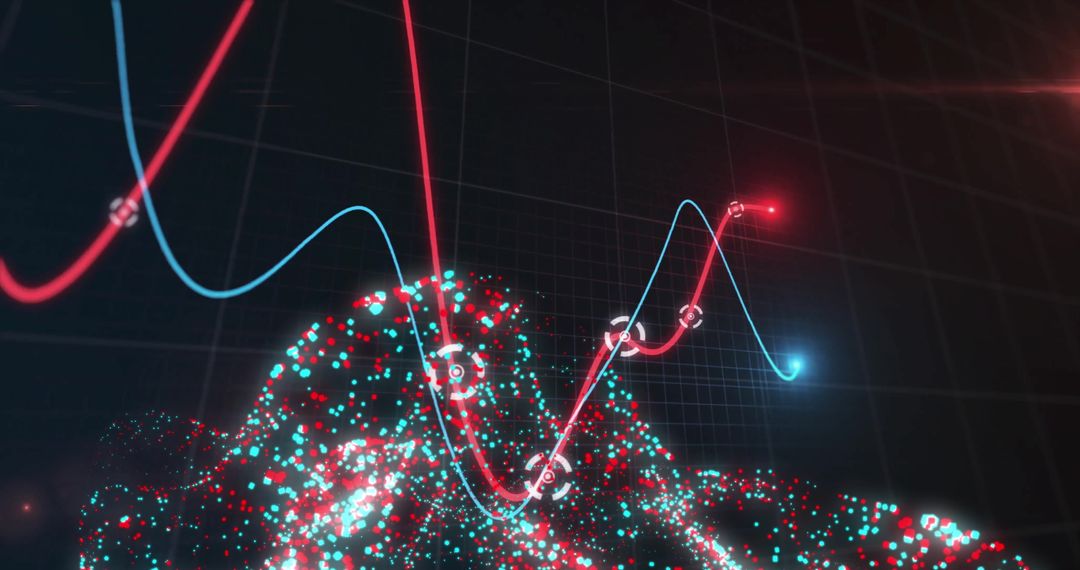
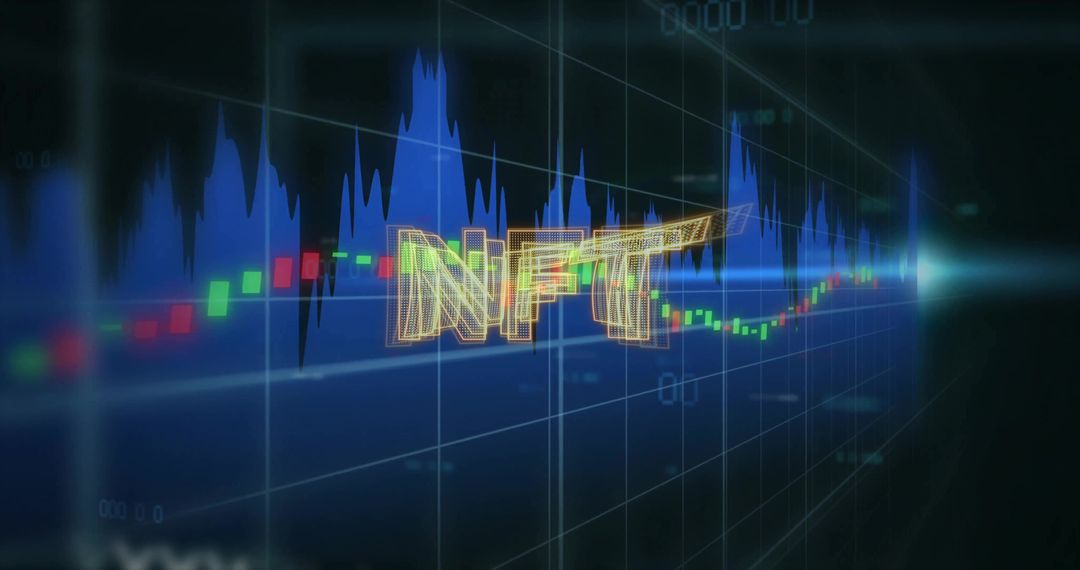
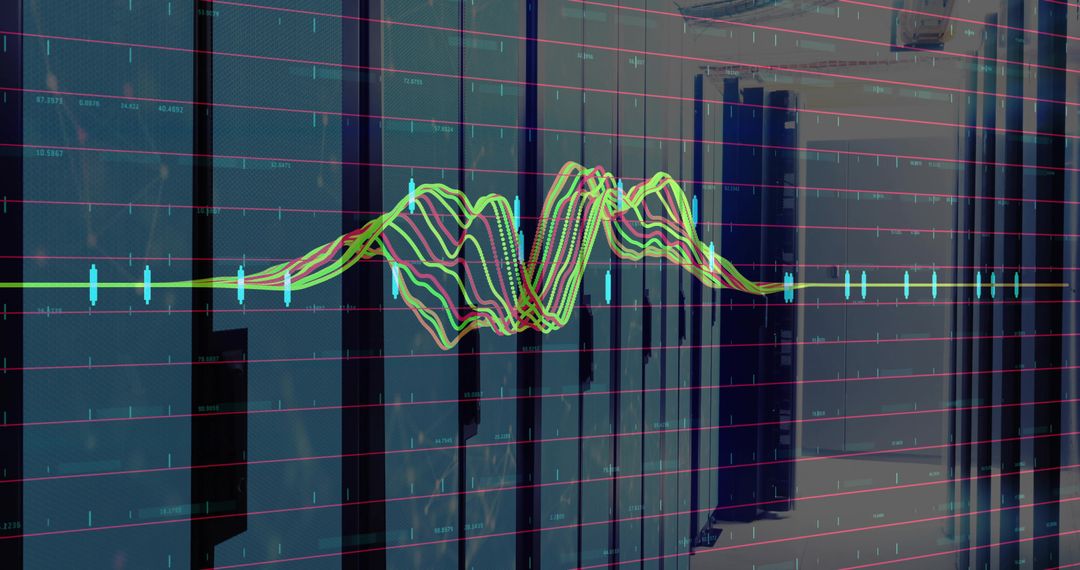
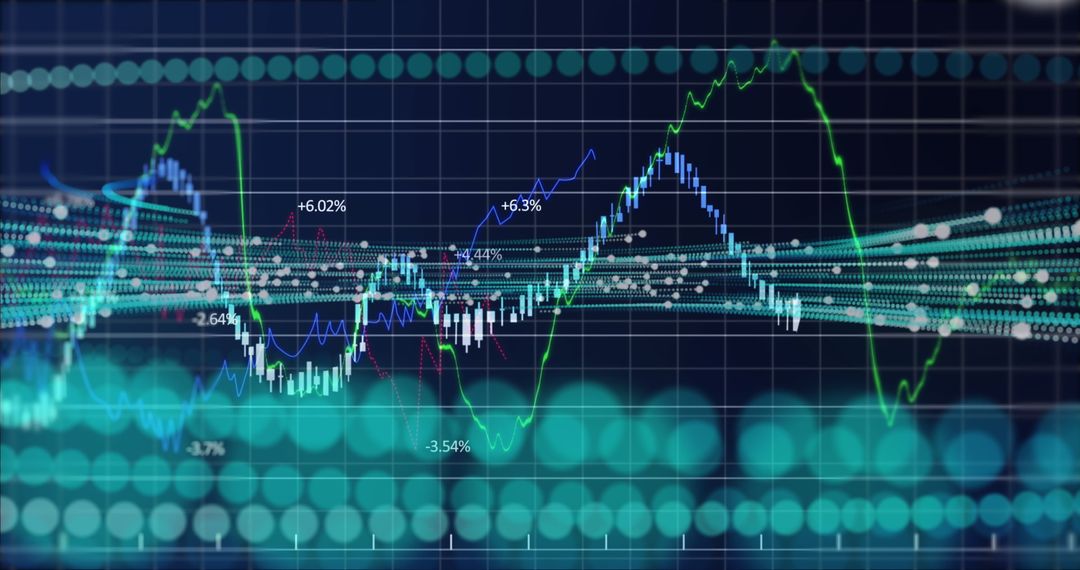
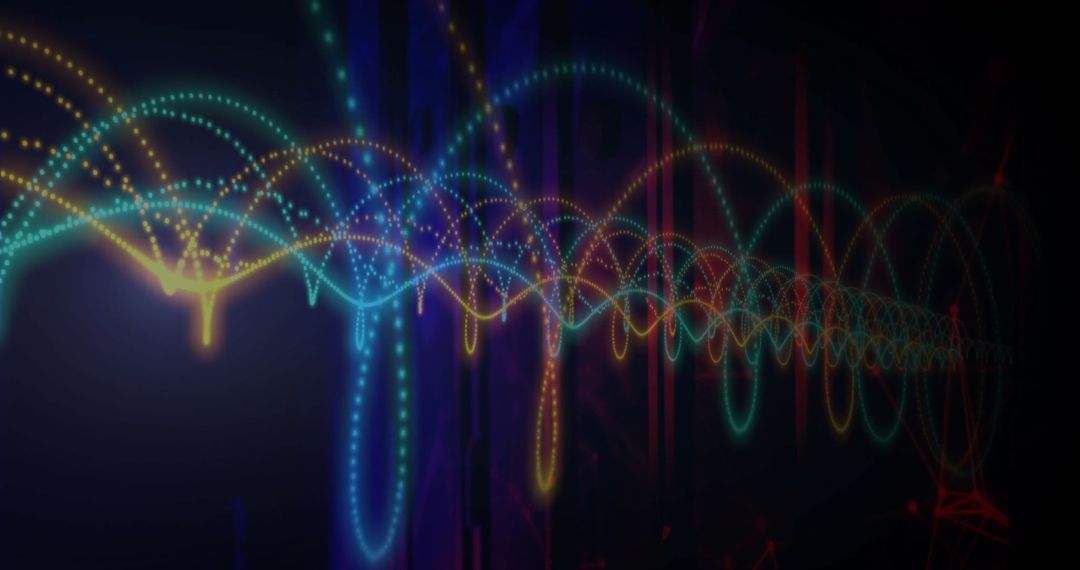
- Futuristic Neon Candlestick in Digital Trading Interface
Futuristic Neon Candlestick in Digital Trading Interface Image

AI Generated Image. This vibrant and modern visualization of two-tone candlestick charts and grid lines exemplifies financial analysis and technology. The glowing light on the left creates a futuristic atmosphere perfect for illustrating innovation in trading software or AI-directed data analysis. Ideal for usage in articles, blogs, or presentations that focus on stock markets, data analysis platforms, or technological advancements in financial markets.
Powered by  - Get 15% off with code: PIKWIZARD15


0
downloads
downloads
Tags:
More
Credit Photo
If you would like to credit the Photo, here are some ways you can do so
Text Link
photo Link
<span class="text-link">
<span>
<a target="_blank" href=https://pikwizard.com/photo/futuristic-neon-candlestick-in-digital-trading-interface/607b225909e4888845b5c44331f8b12d/>PikWizard</a>
</span>
</span>
<span class="image-link">
<span
style="margin: 0 0 20px 0; display: inline-block; vertical-align: middle; width: 100%;"
>
<a
target="_blank"
href="https://pikwizard.com/photo/futuristic-neon-candlestick-in-digital-trading-interface/607b225909e4888845b5c44331f8b12d/"
style="text-decoration: none; font-size: 10px; margin: 0;"
>
<img src="https://pikwizard.com/pw/medium/607b225909e4888845b5c44331f8b12d.jpg" style="margin: 0; width: 100%;" alt="" />
<p style="font-size: 12px; margin: 0;">PikWizard</p>
</a>
</span>
</span>
Free (free of charge)
Free for personal and commercial use.
Author: AI Creator
Similar Free Stock Images

Premium


Premium


Premium


Premium


Premium


Premium


Premium


Premium


Premium


Premium


Premium


Premium


Premium


Premium


Premium


Premium


Premium


Premium


Premium


Premium


Premium


Premium


Premium


Premium