- Home >
- Stock Photos >
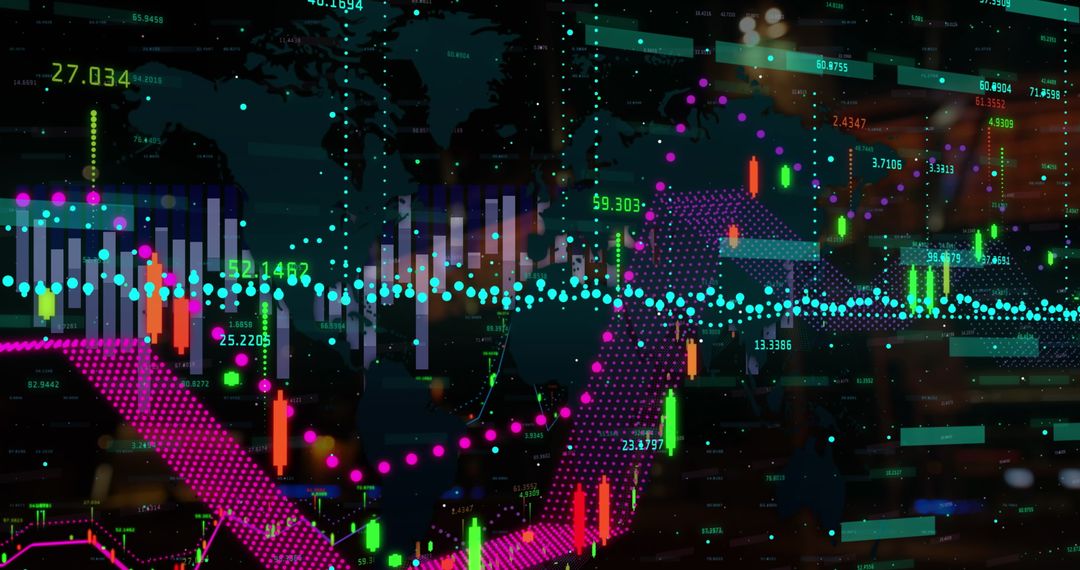
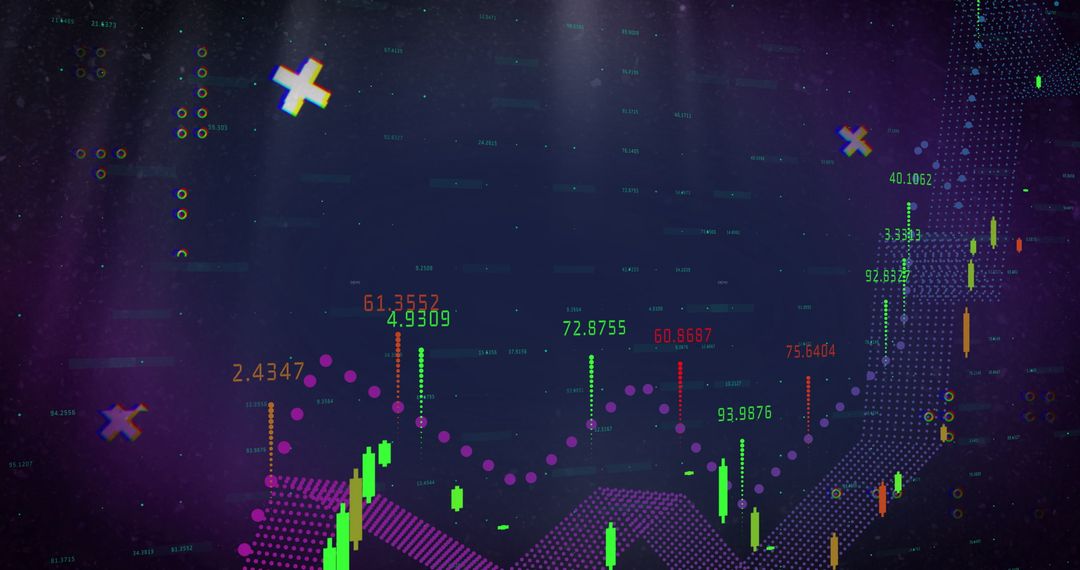
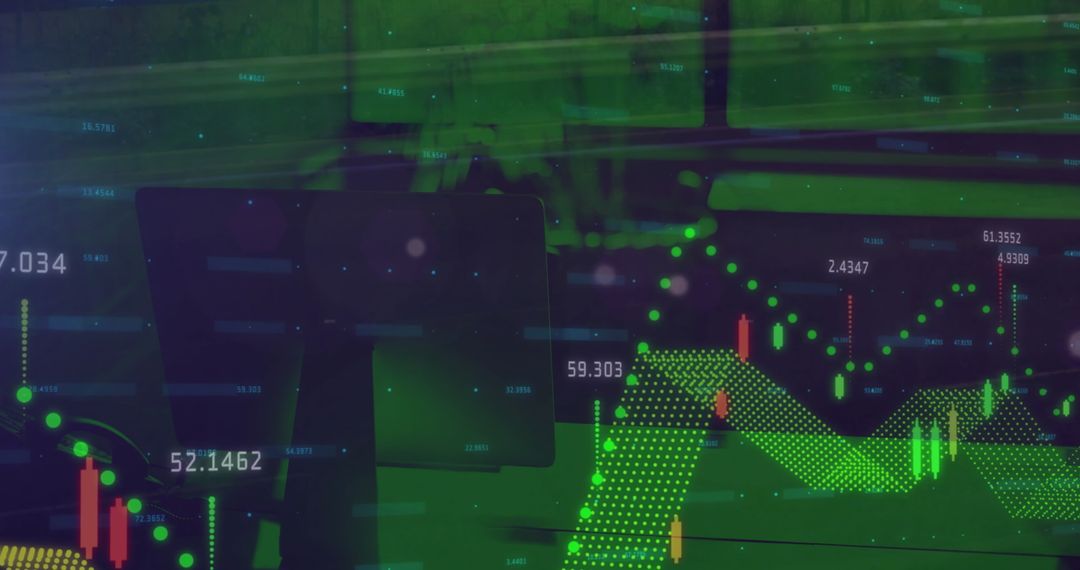
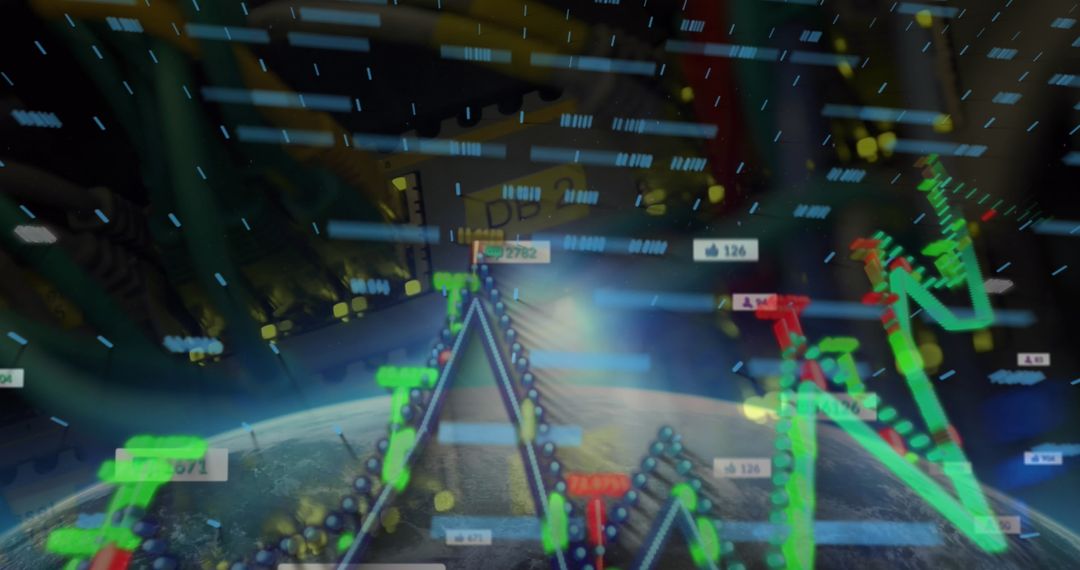
- Futuristic Stock Market Data Analysis with Neon Candlesticks
Futuristic Stock Market Data Analysis with Neon Candlesticks Image

Vibrant display features neon candlesticks showing market trends and fluctuations against abstract world map. Purple and magenta arrows highlight trend lines and KPIs. Ideal for illustrating concepts in trading, finance, advanced analytics, and digital investment platforms.
Powered by 


0
downloads
downloads
Tags:
More
Credit Photo
If you would like to credit the Photo, here are some ways you can do so
Text Link
photo Link
<span class="text-link">
<span>
<a target="_blank" href=https://pikwizard.com/photo/futuristic-stock-market-data-analysis-with-neon-candlesticks/703c9cf472fe6d412039a41ca16401c2/>PikWizard</a>
</span>
</span>
<span class="image-link">
<span
style="margin: 0 0 20px 0; display: inline-block; vertical-align: middle; width: 100%;"
>
<a
target="_blank"
href="https://pikwizard.com/photo/futuristic-stock-market-data-analysis-with-neon-candlesticks/703c9cf472fe6d412039a41ca16401c2/"
style="text-decoration: none; font-size: 10px; margin: 0;"
>
<img src="https://pikwizard.com/pw/medium/703c9cf472fe6d412039a41ca16401c2.jpg" style="margin: 0; width: 100%;" alt="" />
<p style="font-size: 12px; margin: 0;">PikWizard</p>
</a>
</span>
</span>
Free (free of charge)
Free for personal and commercial use.
Author: Authentic Images
Similar Free Stock Images

Premium


Premium


Premium


Premium


Premium


Premium


Premium


Premium


Premium


Premium


Premium


Premium


Premium


Premium


Premium


Premium


Premium


Premium


Premium


Premium


Premium


Premium


Premium


Premium