1. Home > 
  2. Stock Photos > 
  3. Futuristic Stock Market Data Visualization Technology

Futuristic Stock Market Data Visualization Technology Image

Futuristic Stock Market Data Visualization Technology

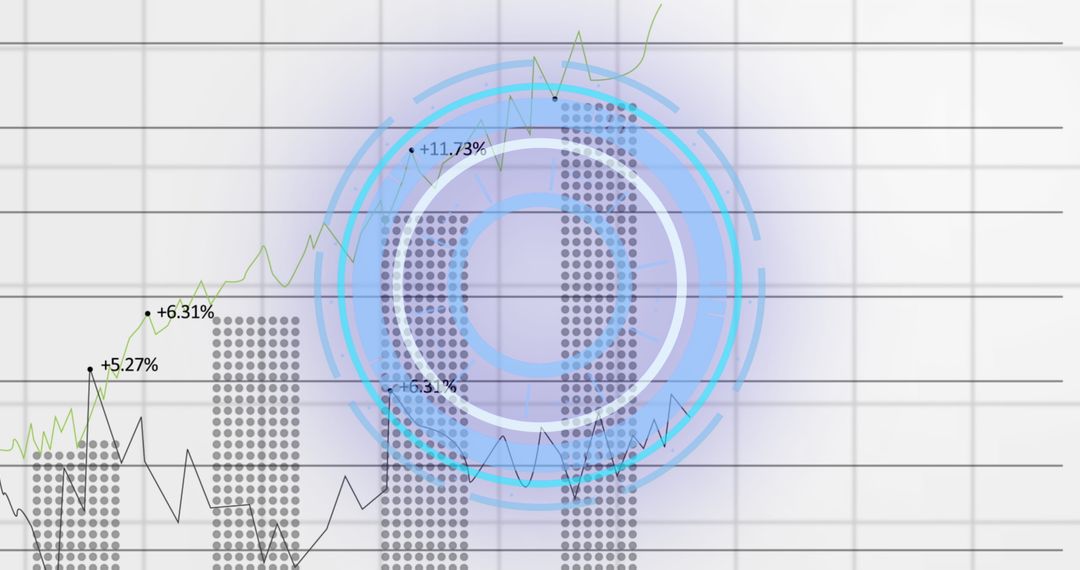
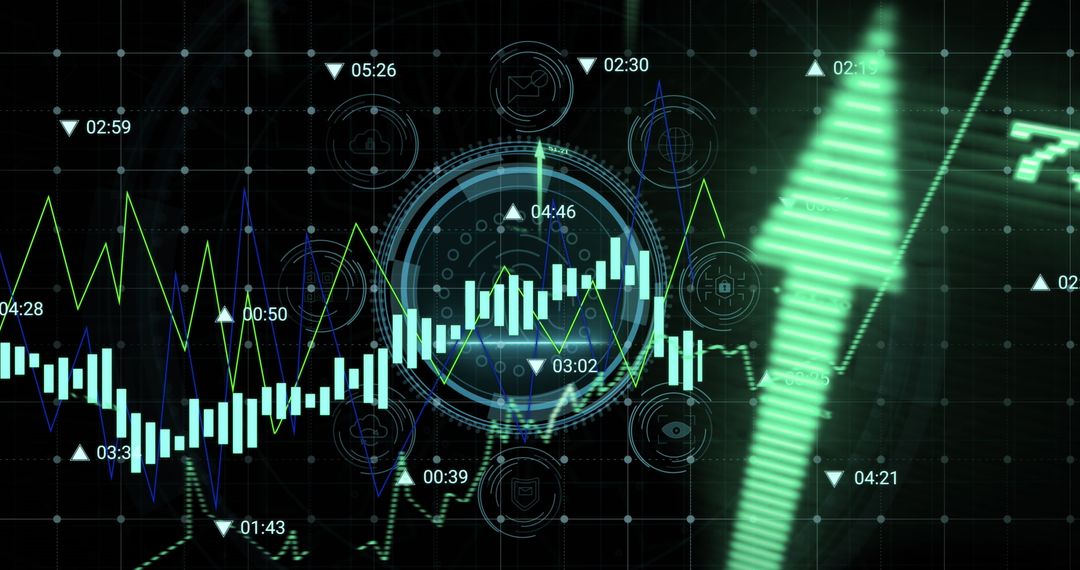
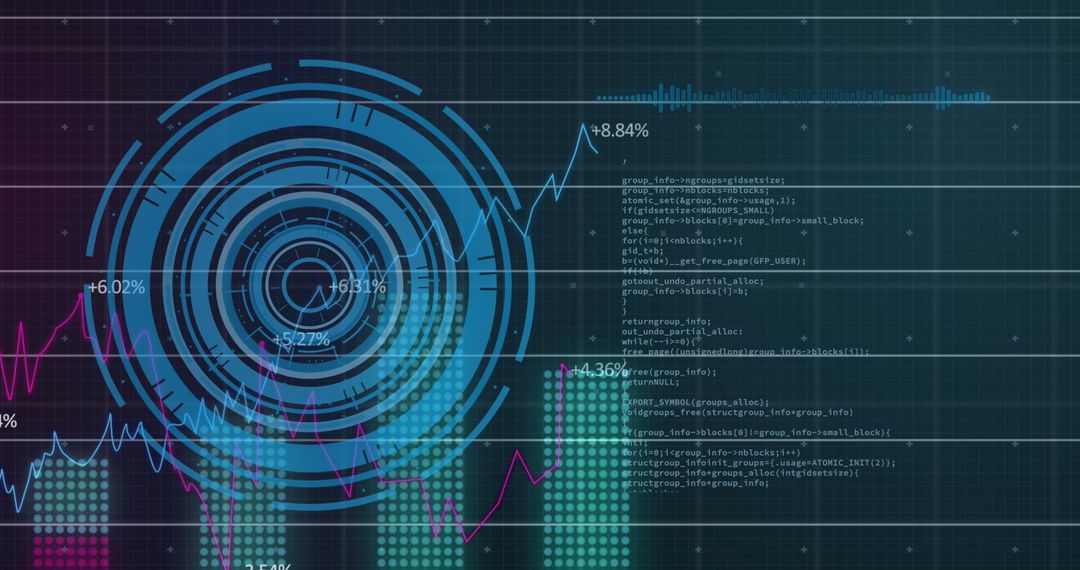
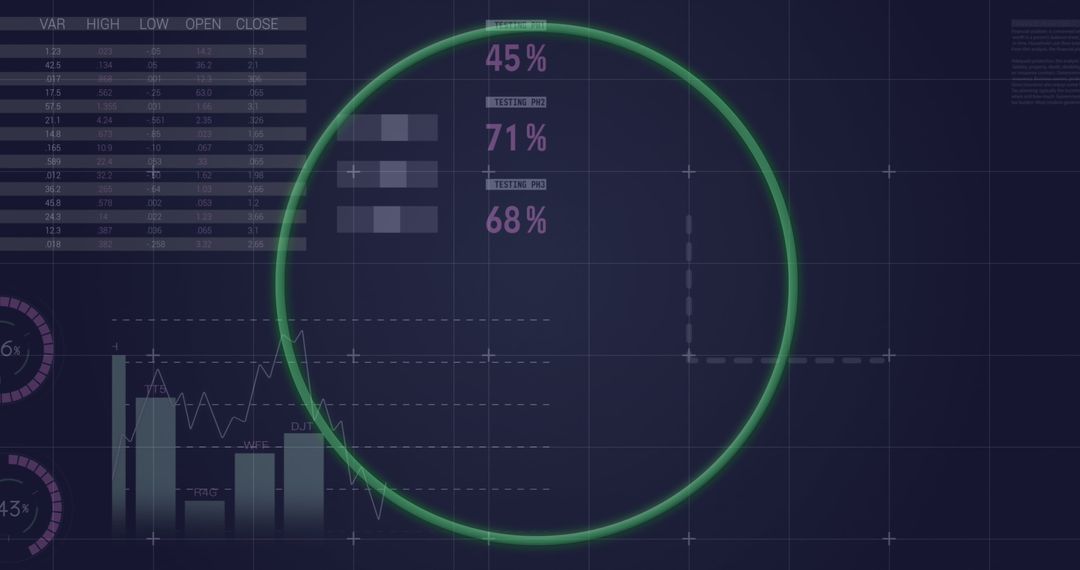
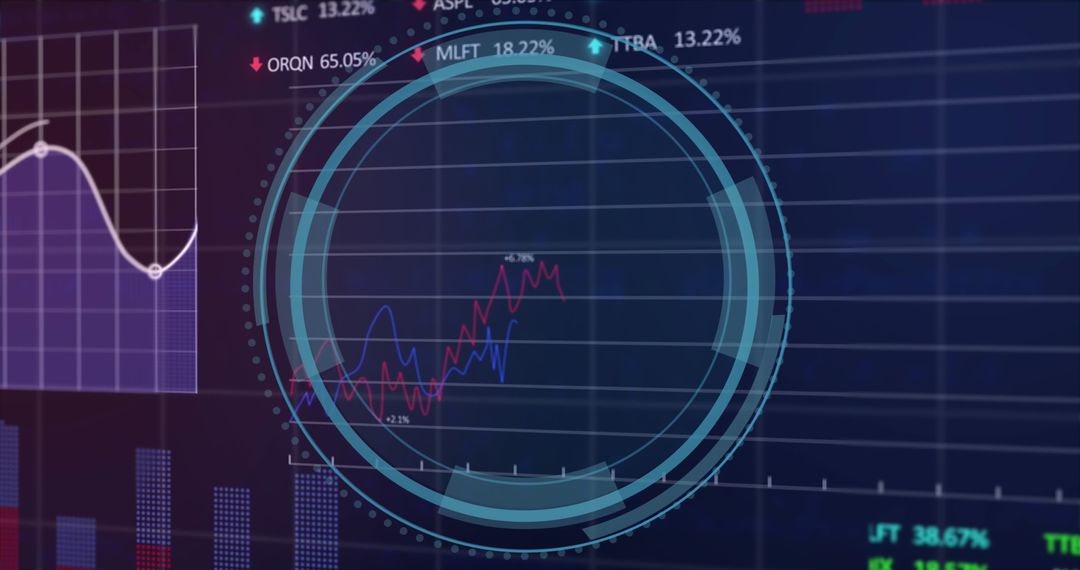
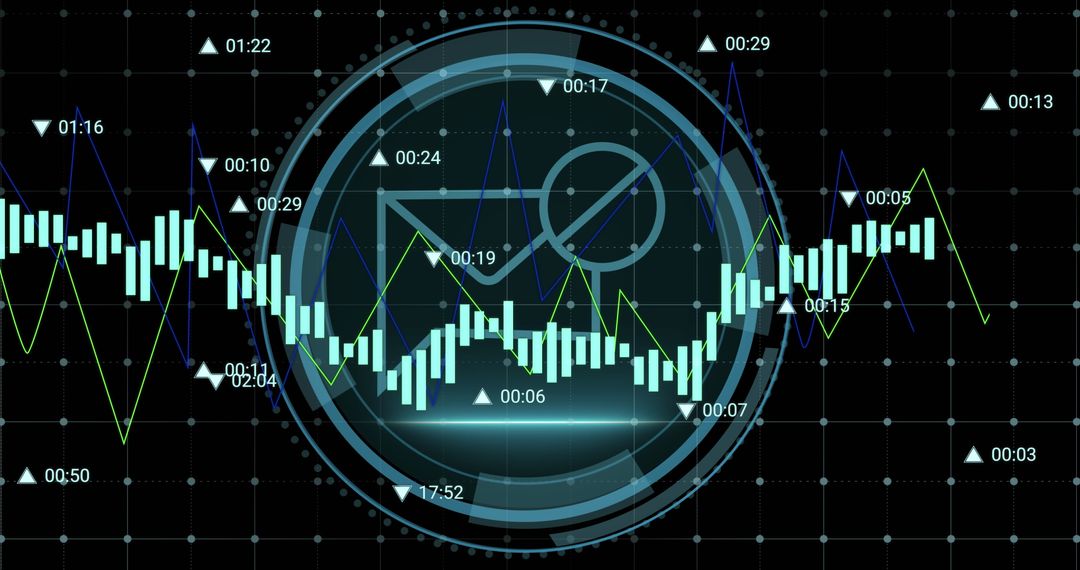
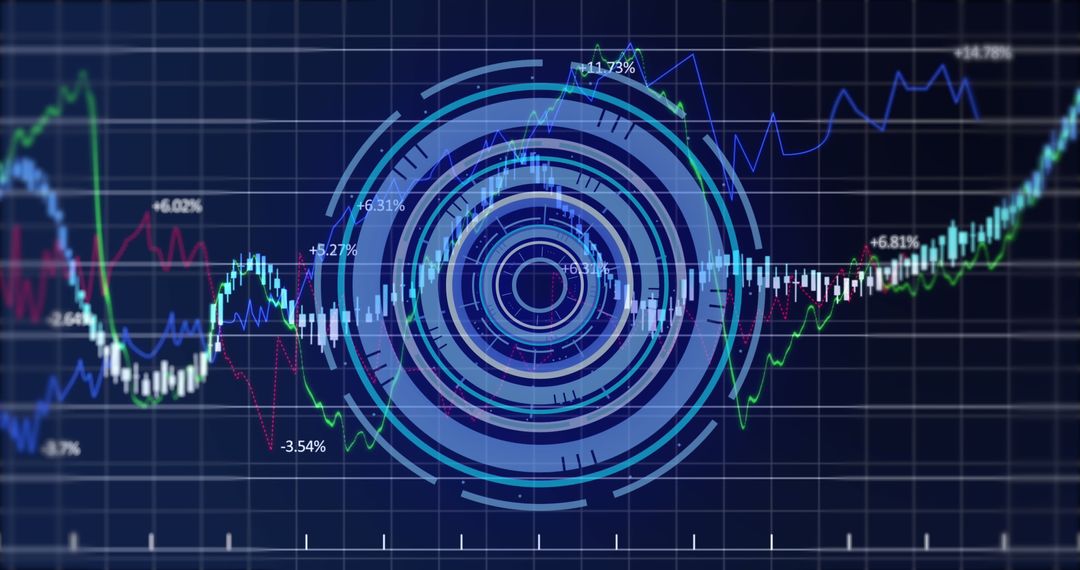
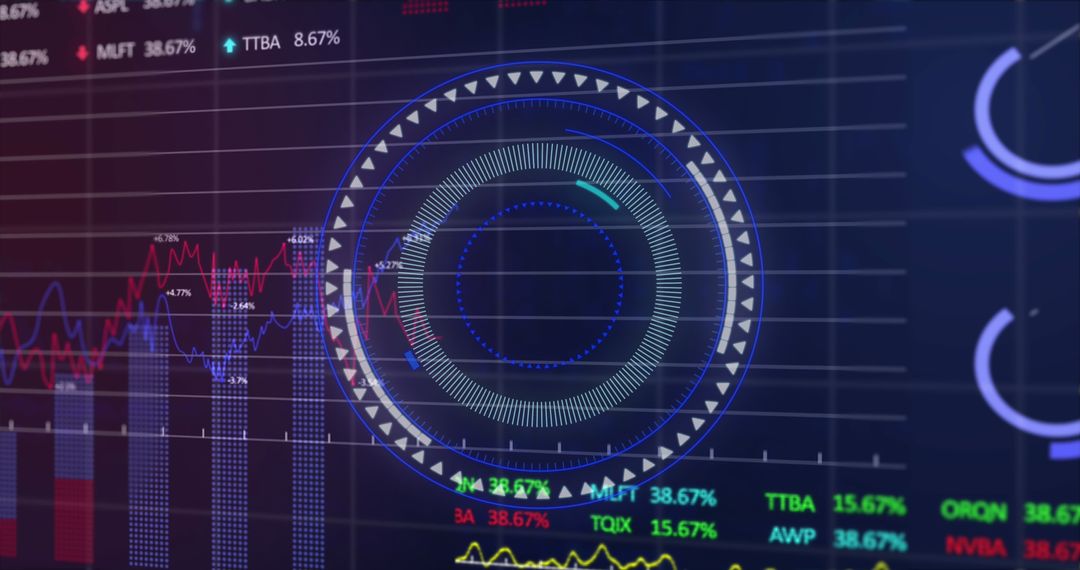
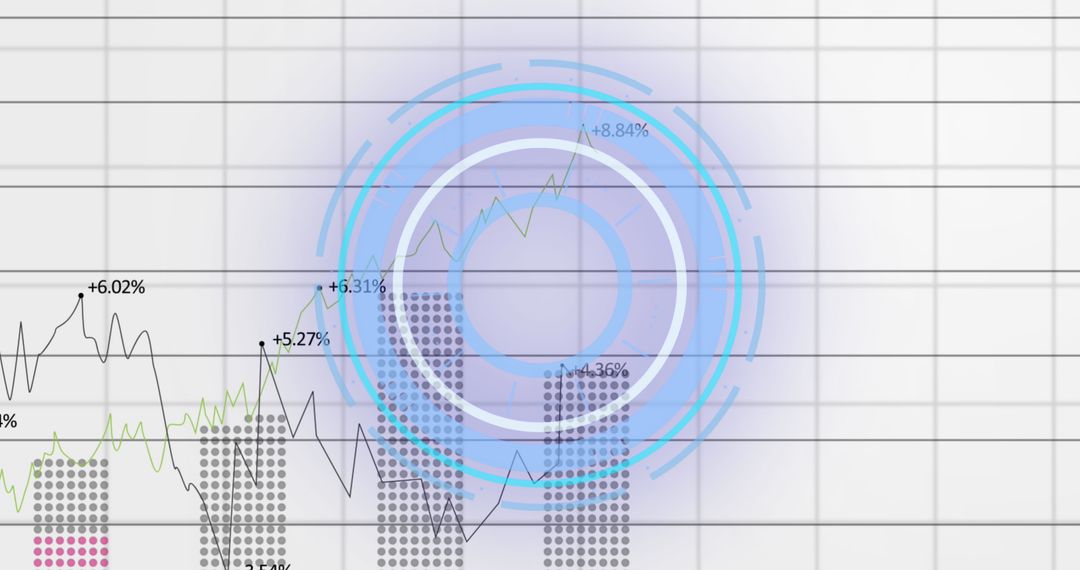
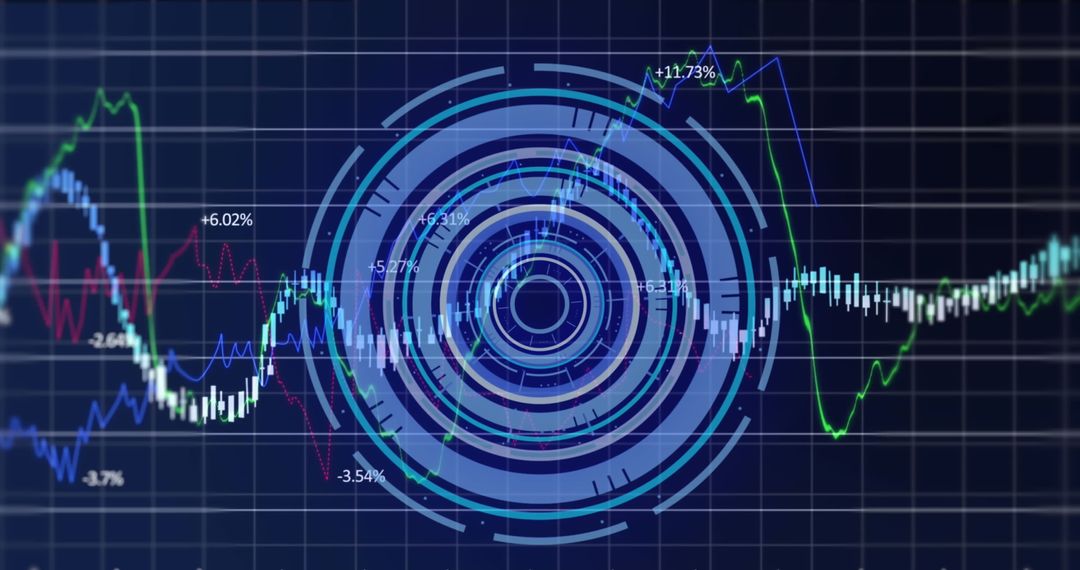
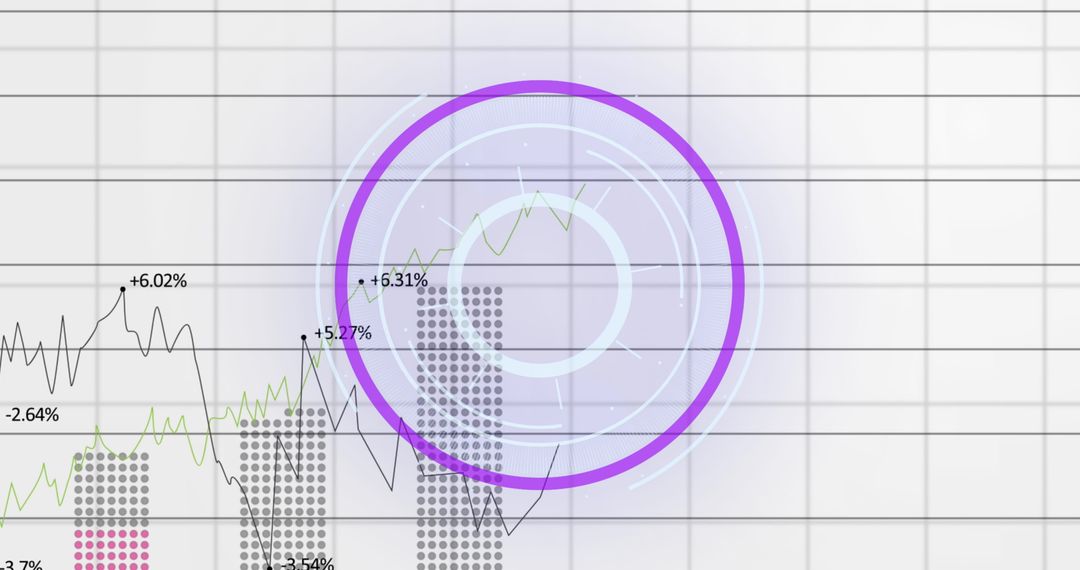
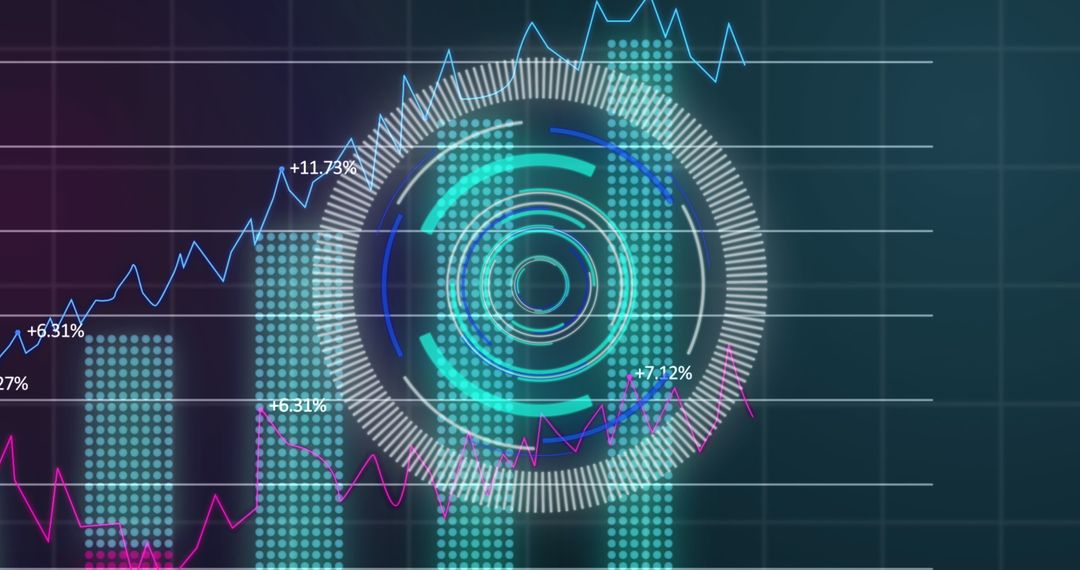
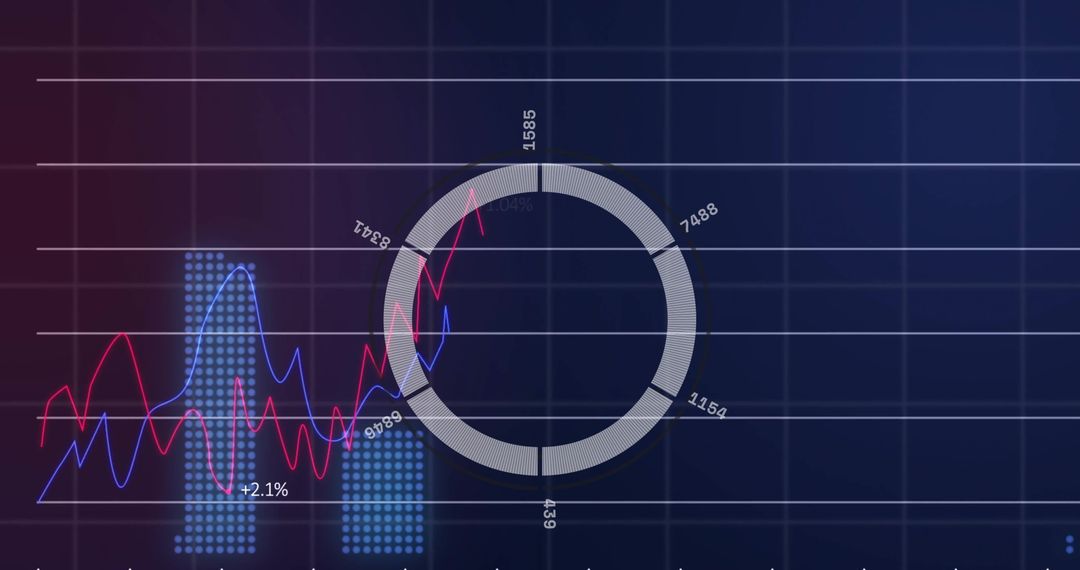
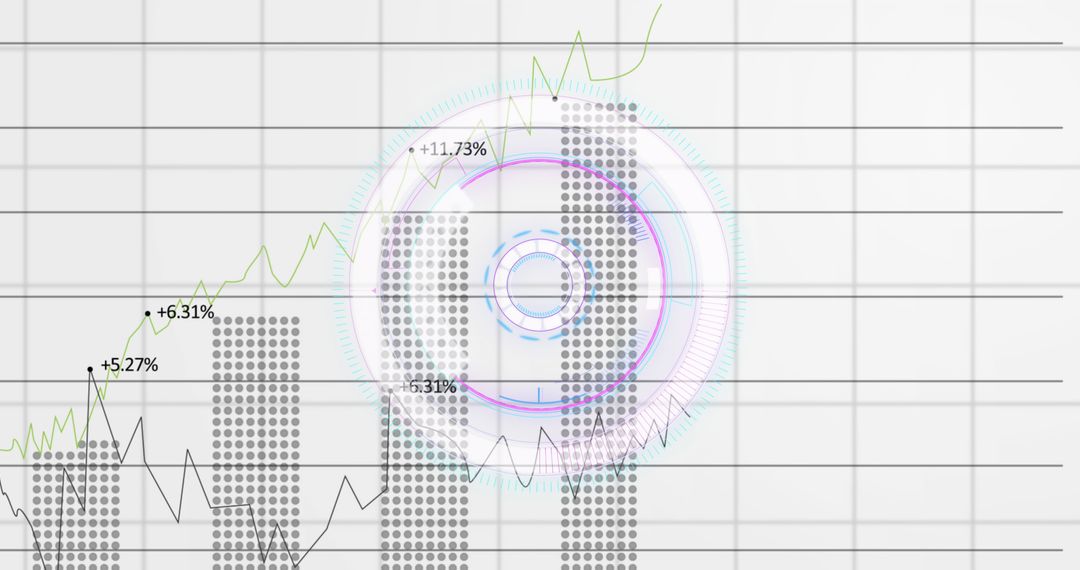
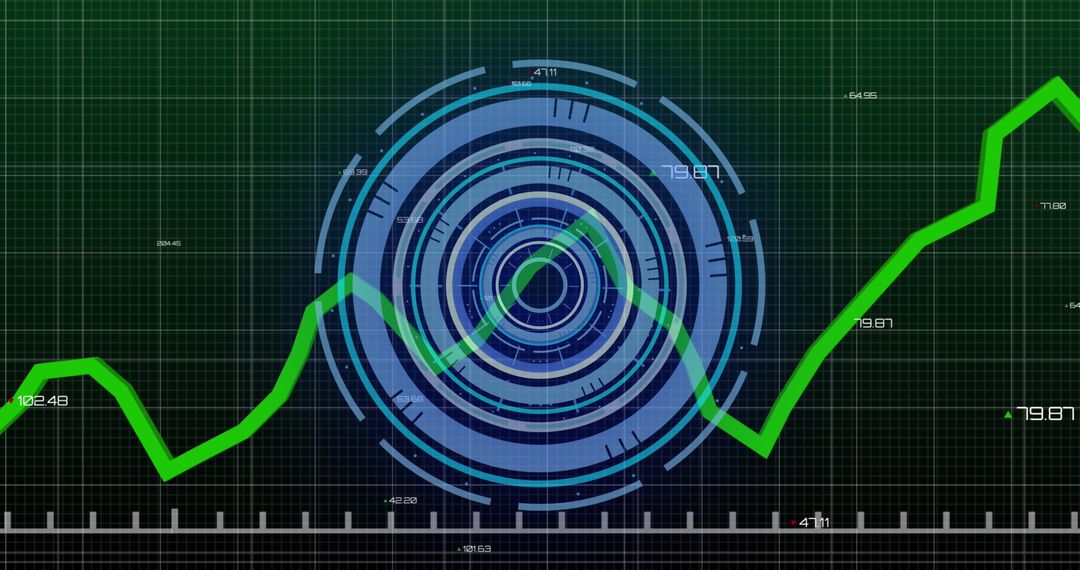
Digital rendering of stock market data showing graphs and colorful tickers. Ideal for illustrating concepts related to technology-driven finance, data analysis, or investment trends. Suitable for websites, presentations, or marketing materials focused on the intersection of finance and technology in global research or education.

Powered by Shutterstock logo - Get 15% off with code: PIKWIZARD15
Businessman using laptop computer analyzing sales data and financial growth graph chart report. Business planning, strategy and development. Financial accounting. market research, data analysis - Powered by Shutterstock - Get 15% off with code: PIKWIZARD15Businessman's Hand Holding Holographic Stock Market Growth Chart with Green Arrow Showing Positive Financial Trends and Stock Candlestick Data on Digital Interface and Finance - Powered by Shutterstock - Get 15% off with code: PIKWIZARD15Two Traders Having a Meeting in a Modern Monitoring Office with Analytics Feed on a Big Digital Screen. Monitoring Room with Brokers and Finance Specialists Sit in Front of Computers. Colleagues Talk. - Powered by Shutterstock - Get 15% off with code: PIKWIZARD15Woman hold smartphone use pc at workplace. Project stats financial data sales charts on laptop and cellphone screen, close up view over shoulder. Report preparation, synchronization for safety concept - Powered by Shutterstock - Get 15% off with code: PIKWIZARD15Dashboard finance management on laptop computer analyzing sales data and growth graph chart report. Business planning, strategy and development. Financial accounting. market research, data analysis - Powered by Shutterstock - Get 15% off with code: PIKWIZARD15

Credit Photo

If you would like to credit the Photo, here are some ways you can do so

Free (free of charge)

Free for personal and commercial use.

Author: Awesome Content

Similar Free Stock Images

Futuristic Neon Data Scanner on Digital Financial Interface
Premium
Man look at the dashboard with graphs and charts. Concept of data management system, business intelligence, data statistics, marketing analysis, key performance indicators (KPI) and analytics.
World Map with Falling Line Graphs Indicating Global Economic Decline
Digital Data Processing with Technological Interface Design
Financial Data Graph Rendering Global Market Trends
Dynamic Line Chart with Histogram on Digital Grid Background
Premium
Businessman Drawing Upward Arrow on Digital Stock Market Graph with Trading Data, Buy and Sell Indicators, Representing Financial Growth, Investment Success Foreign currency trading and Forex Trading
Digital Financial Data Visualization with Futuristic Elements
Digital Finance: Modern Stock Market Analysis Display
Digital Financial Dashboard with Graphs and Data Visualization
Digital Data Visualization with Growth Arrow and Graphs
Premium
Businessman in suit analyzes stock market data using digital tablet and stylus with financial charts in the background. Investment, finance, trading. Stock market and analytics.
Digital Financial Data Overlay on Urban Street Scene
Futuristic Financial and Technological Data Visualization Concept
Dynamic Business Data and Cityscape Visualization
Digital Financial Data Analysis and Velocity Indicator Concept
Premium
Businessman analyzing stock market chart with stylus pen on virtual screen, representing financial trading, investment analysis, and stock market data visualization
Neon Green Circular Interface with Statistical Data Visualization
Futuristic Technology Interface with Digital Financial Graphs
Dynamic Financial Data Visualization on Digital Grid Background
Neon Round Scanner with Statistical Data Display
Premium
Professional Financial Data Analysts Working in a Modern Monitoring Office with Live Analytics Feed on a Big Digital Screen. Monitoring Room with Finance Specialists Sit in Front of Computers.
Futuristic Data Visualization and Graph Analytics on Green Interface
Futuristic Keyboard Analytics Display with Digital Graphs and Numbers
Digital Financial Data and AI Illustration Networking Globally
Cybersecurity Data Processing with Digital Analytics
Premium
Young Happy Businesswoman Using Laptop Computer in Modern Office with Colleagues. Stylish Beautiful Financial Advisor Working. VFX Hologram Edit Visualizing Stock Exchange Interface, Opened Charts.
Dynamic Financial Data Overlaid on Grid Background
Abstract Digital Interface Showing Data Analysis Concept
Global Data Visualization With Dynamic Graphs and World Map Background
Futuristic Data Interface with Digital Arachnetic Grid
Digital Financial Data and Global Business Analytics
Financial Data Overlay on Cityscape Visualizing Market Trends
Premium
Man look at the dashboard with graphs and charts. Concept of data management system, business intelligence, data statistics, marketing analysis, key performance indicators (KPI) and analytics.
Digital Interface with Virtual Data Surging Across Connection Globes
Financial Data Flow against Urban Skyline Backdrop
Digital Financial Data Analysis with Graph and HUD Interface
Futuristic Digital Interface Analyzing Stock Market Trends
Premium
Business visual data analyzing technology by creative computer software . Concept of digital data for marketing analysis and investment decision making .
Financial Graph and Waves Representing Market Trends and Data
Digital Financial Data with Graph and Grid Patterns
Dynamic Stock Market Graphs and Financial Data
Dynamic Financial Charts and Graphs Indicating Market Trends
Premium
Explore the stock market trends for 2024 with analytical visuals of businessman planning long term investments and future business growth, Navigate towards success with smart strategies.
Digital Data Scanning with Global Financial Analytics Interface
Futuristic Digital Interface for Finance and Technology
Cyber Security Technology in Warehouse Management Systems
Digital Data Visualization with Trend Lines and Percentage Changes
Premium
Showing digital market display scrolling stock symbols on dark grid, with yellow line graphs. Financial technology, data visualization, stock market analysis, trading platform, digital interface,
Dynamic Data Visualization with Financial Charts and 3D Elements
Conceptual Financial Data and Scope Scanning Over Grid Background
Digital Finance Analysis: Interactive Data Visualization on Screen
Digital Data Processing Interface with Graph Analysis
Premium
Touching stock market graph on a touch screen device. Trading on stock market concept. Closeup photo.
Data Visualization on Security Shield Interface for Cyber Security
Futuristic Digital Interface with Data Patterns
Futuristic Financial Data Processing with Digital Interface Elements
Data Processing Interface with Digital Financial Trends Overlay
Premium
Stock Market Data Visualization and Financial Trading Analytics Dashboard on Touchscreen Tablet.
Cybersecurity Analysis Interface with Data Visualization
Financial Data Processing with Chart and Dark Grid Background
Digital Visualization of Global Networking with Statistical Graphs
Digital Stock Market Trends and Financial Growth Analysis
Digital Financial Data Overlaying City Skyline at Dusk
Digital Interface with Data Analytics Visuals
Premium
Businesswoman analyzes to chart data business on a visual screen dashboard, technology devices and screens visible in the background, financial planning, market research, and the stock market.
Data Recovery Progress Display on Digital Interface
Rising Digital Graph and Data Visualizations on Black Background
Futuristic Scanner with Data Stream on Dark Background
Futuristic Global Business Data with Digital Interface
Premium
A magnifying glass over a financial chart, illustrating market analysis and business concepts, in blue light against a dark background.
Optimized Statistical Data Overlain on Corporate Architecture
Dynamic Data Graphs on Digital Interface Background
Dynamic Financial Growth Digital Chart Display
Data Analytics Graphs on Digital Interface Background
Premium
A professional businessman showcases stock market data through a digital interface, set against a modern city backdrop, emphasizing the importance of financial analysis in investment strategies.
Futuristic Data Visualization Dashboard with Technology Interfaces
Digital Interface with Data Visual Tech Elements
Financial Graphs Overlaying Industrial Junkyard
Abstract Data Visualization with Dynamic Charts and Graphs
Premium
Stock Market Data Visualization and Financial Trading Analytics Dashboard on Touchscreen Tablet.
Neon Digital Interface with Financial Data Analytics
Abstract Digital Charts with Social Media Metrics Rising
Digital Data Visualization with Financial Indicator
Digital Circular Interface with Graphs on Green Grid
Premium
Stock Market Data Visualization and Financial Trading Analytics Dashboard on Touchscreen Tablet.
Digital Interface with Data Visualization and Abstract Light Contours
Digital Scope with Financial Data Visualization
Digital Data and Financial Charts on White Background
Digital Data Processing on Circuit Board Interface
Premium
Displaying stock market data on dotted LED grid at dusk skyline, with digits and symbols. Financial, technology, digital, data, analytics, futuristic, urban
Digital Data Visualization with Graphs and Scan Interface
Digital Data Interface with Graph and Chart Analysis
Graph Lines Portraying Financial Data Trends
Financial Data Visualization with Cityscape Overlay
Digital Interface with Data Graph and Processing Circle
Financial Chart and Rotating Globe on Digital Grid Background
Premium
Financial chart and investment graph analysis stock on tablet screen. Data dashboard and report insight for finance growth, stock market, and business performance strategy.
Futuristic Interface with Data Trends and Diverging Charts
Dynamic Financial Data Processing with Futuristic Graphic Interface
Futuristic Data Processing Animation with Media Icons
Abstract Financial Data Display with Upward Graph Curves
Premium
Digital economic growth chart with a rising trend towards 2025, symbolizing future market predictions.
Futuristic Financial Interface with Neon Scanner
European Market Data Overlay with EU Flag and Financial Graphs
Futuristic Digital Blue Interface with Graphs and Data
Digital Interface with Scanning and Financial Analysis Concept
Premium
Persons Hand Holding Tablet Digital Financial Graph Analysis, Upward Chart Showing Growth, Business Interface, Stock Market Data, Smartphone Interaction
Digital Data Analysis Interface with Graphs and Scope
Digital Interface Concept with Data Circles and Graph
Futuristic Data Processing Interface with Digital Hologram
Rising Financial Data Graph on Digital Grid Background
Premium
Businessman using digital tablet analyzing sales data and financial growth graph chart report. Business planning, strategy and development. Financial and banking. market research, business analysis
Futuristic Green Data Graph with Digital Interference Design
Digital Data Prozessing with Global Interface Design
Digital Data Processing with Tech Interface Graphs
Cybersecurity Concept with Declining Data Graph and Digital Shield
Premium
A vibrant financial chart displays stock market data against a city skyline at dusk, emphasizing dynamic market fluctuations
Dynamic Digital Graph Showing Global Data Movement
Interactive Social Media Metrics Overlaid on Business Data Graph
Futuristic Graph and Data Technology Interface
Digital Data Visualization with Global Connection Concept
Premium
Conceptual visual of data analysis with black woman working in the office
Digital Data Visualization with Circular Interface Elements